While Major League Baseball is what you are most likely to see on television, baseball fans in cities across the country flock to the ballpark to watch the stars of tomorrow hone their craft in Minor League Baseball. These games are less expensive and less crowded than the average Major League game, so they are more accessible to the average family. With that in mind, SmartAsset analyzed the data for the sixth consecutive year to find the best minor league baseball towns in America.
To find the best towns for minor league baseball, SmartAsset analyzed nine different factors. We used those metrics to come up with two scores – one related to the game-day experience and the other related to the quality of life in the city. We used these two scores to create our final rankings. For details on data sources and how we put it all together, check out the Data and Methodology section below.
This is SmartAsset’s sixth annual study of the best minor league baseball towns. Check out the 2018 version here.
Key Findings
- A new champion. Nashville had been the top city in this study for two years running, but this year, Music City isn’t even in the top 25. Round Rock, Texas, last year’s No. 2 city, ascended to the top of the rankings this year.
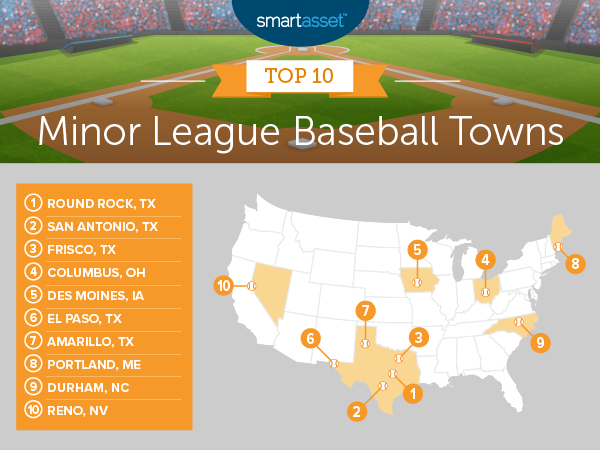
- Texas hits it out of the park. Five of the top 10 cities in this ranking come from the Lone Star State.

1. Round Rock, TX (Round Rock Express)
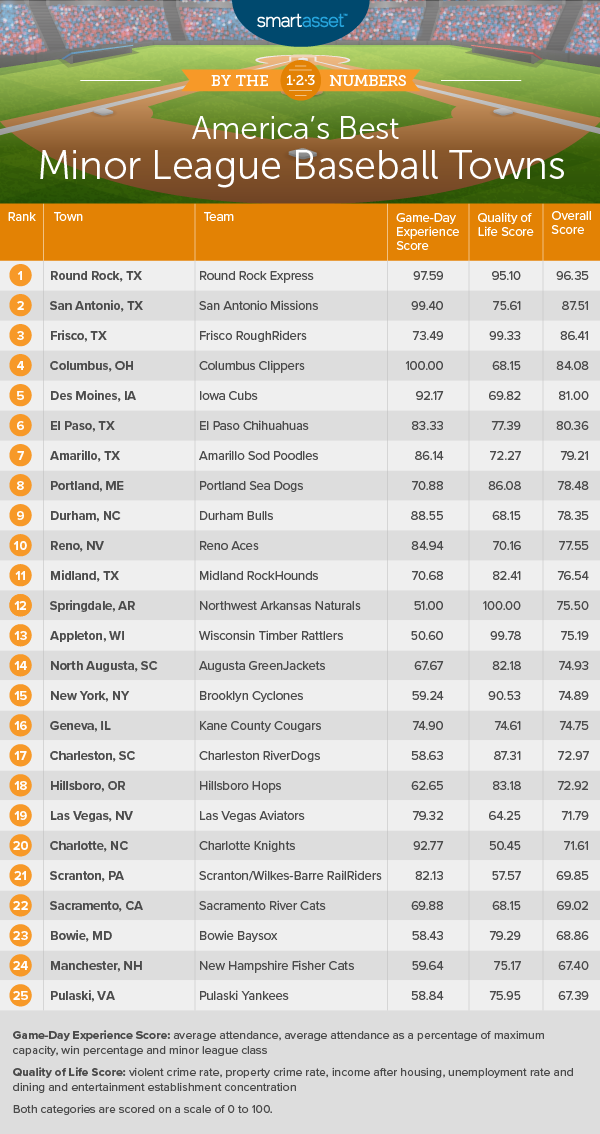
Topping our list is Round Rock, Texas, home of the Express, a Triple-A affiliate of the Houston Astros. Round Rock does fairly well in both game-day and quality of life metrics. It has the 11th-highest attendance, an average of 7,849 fans per game. It also has a decent record, winning 60% of games this year. The median income after housing costs is $60,455, the ninth-highest of all 157 cities we considered in this study, which hopefully means some extra cash for fans to spend on a ball game or two.
2. San Antonio, TX (San Antonio Missions)
San Antonio, Texas comes in second on our list. The San Antonio Missions average 7,578 fans per game, a whopping 122% of their stadium’s capacity (the highest rate for this metric in the study overall), showing fans really want to see the Triple-A team in action. San Antonio also ranks in the top 30 in two of the quality of life metrics, with a low unemployment rate of 3.2% and a high dining and entertainment establishment rate of 11% of all establishments.
3. Frisco, TX (Frisco RoughRiders)
Another Texas city comes next: Frisco, home of the RoughRiders. This is the highest-ranked Double-A class team. This affiliate of the Texas Rangers averages 6,802 fans per game, and though the team isn’t knocking it out of the park when it comes to game-day scores, Frisco does well in quality of life metrics. The median income after housing costs is $98,465, the highest in our study. The violent crime rate is eighth-lowest in the study, with just 102 incidents per 100,000 residents.
4. Columbus, OH (Columbus Clippers)
The Columbus Clippers in Ohio, ranking fourth in the study, are the Triple-A affiliate of the Cleveland Indians and close to the top of this study in terms of game-day score. The average attendance of 8,684 is second-highest in the study, and the team is in the top 25 performance-wise, winning 58% of its games. Quality of life metrics for Columbus are not quite as strong as those for other top-ranking minor league baseball towns, but 10% of the city’s establishments are dedicated to dining and entertainment.
5. Des Moines, IA (Iowa Cubs)
Des Moines, Iowa, the home of the Triple-A Iowa Cubs, takes the No. 5 spot. The Cubs have an average attendance of 9,299 fans, the best rate for this metric in the study. That’s 81% of the stadium’s capacity, a top-25 rate. Des Moines’ unemployment rate of just 2.7% is also the 10th-lowest in the study.
6. El Paso, TX (El Paso Chihuahuas)
We’re back in Texas for the sixth city on our list, El Paso, where the Chihuahuas are the Triple-A affiliate of the San Diego Padres. The team ranks in the top 30 of the study overall for both attendance (5,759 per game on average) and record (winning 57% of games). The city has a low rate of violent crime, just 379 per 100,000 residents.
7. Amarillo, TX (Amarillo Sod Poodles)
The final Texas city in the top 10, and ranking seventh overall, is Amarillo, home of the Sod Poodles, a Double-A team affiliated with the San Diego Padres. The team has a 90% attendance rate, 10th-highest of the cities we analyzed. The median income after housing costs is $40,962, a top-35 rate.
8. Portland, ME (Portland Sea Dogs)
Portland, Maine is eighth on our list. The Portland Sea Dogs are the Double-A affiliate of Boston Red Sox. Portland scores in the top half of the study for all of our quality of life metrics. There is a violent crime rate of just 277 incidents per 100,00 residents and a low unemployment rate, just 2.3%. The team didn’t do great on the field this year, winning just 49% of games, but the team still averages 5,677 fans through the turnstiles each game.
9. Durham, NC (Durham Bulls)
Durham, North Carolina takes the No. 9 spot and is home to the Durham Bulls, the Triple-A affiliate of the Tampa Bay Rays. The Bulls average 7,668 fans per game, 77% of its stadium’s capacity. They had a good year on the field, winning 54% of their games. Around 10% of the establishments in the city are dedicated to dining and entertainment. The unemployment rate is fairly high, though, at 4%.
10. Reno, NV (Reno Aces)
Rounding out the top 10 is Reno, Nevada, home of the Triple-A Reno Aces, an affiliate of the Arizona Diamondbacks. The team fills 95% of its stadium capacity, the eighth-highest rate in the study, and has the seventh-highest total average attendance, 8,542 fans per game. Reno ranks in the better half of the study on three of five of our quality of life metrics: property crime rate, income after housing costs and unemployment rate.

Data and Methodology
To find the best minor league baseball towns in the country, SmartAsset analyzed the following metrics:
Game-day Experience Factors:
- Average attendance. This is the average number of fans who attended each game. Data comes from milb.com and is for the 2019 season.
- Average attendance as a percentage of maximum capacity. Data on attendance for the 2019 season comes from milb.com and data on maximum capacity comes from www.baseballpilgrimages.com.
- Win percentage. Data comes from www.baseballamerica.com and is for the 2019 season.
- Minor league class. There are six minor league classes (Triple-A, Double-A, High Class A, Low Class A, Class A Short, Rookie). We gave cities with higher class teams a better score.
Quality of Life Factors:
- Violent crime rate. This is the number of violent crimes per 100,000 residents. Data comes from the 2017 and 2016 FBI Uniform Crime Reporting database. For cities where there was no data available, we used the average from all cities in the study.
- Property crime rate. This is the number of property crimes per 100,000 residents. Data comes from the 2017 and 2016 FBI Uniform Crime Reporting database. For cities where there was no data available, we used the average from all cities in the study.
- Income after housing. This is median household income minus median housing costs. Data comes from the U.S. Census Bureau’s 2017 5-year American Community Survey.
- Unemployment rate. Data comes from the Bureau of Labor Statistics (BLS) and is the unemployment rate for June 2019.
- Dining and entertainment establishments. This is the number of bars, restaurants and entertainment establishments as a percentage of all establishments. Data comes from the Census Bureau’s Business Patterns Survey and is for 2016.
First, we ranked each city in each metric. We created separate indexes for the quality of life metrics and for the game-day experience metrics, assigning a score to each based on their rankings in each category. Every metric received equal weighting, except for the two crime metrics, which received a half weight. Then we averaged the two indexes to come to a final score. We ranked cities from highest to lowest based on this final score.
Tips for Making the Most of Your Money
- Get a financial coach. Want to plan for a future where you can attend all the baseball games you want? Consider finding a financial advisor. SmartAsset’s free tool matches you with financial advisors in your area in 5 minutes. If you’re ready to be matched with local advisors that will help you achieve your financial goals, get started now.
- Home run savings. Going to baseball games and other entertainment spending should be planned out. Use SmartAsset’s free budget calculator to see how much you can spend on fun each month.
Photo credit: ©iStock.com/ Candice Estep