 Written by
  Edited by
Passing the CFP® exam is a requirement to become a Certified Financial Planner™ professional. On test day, you’re allowed to bring an approved battery-powered, non-programmable financial calculator with you. The CFP Board does not specify how many calculation questions are included on the exam, but you can prepare for them by familiarizing yourself with the formulas used to complete them. You’ll find them listed on the CFP formula sheet, which is included in the exam candidate handbook.
Are you looking to expand the marketing of your financial advisor practice? Try SmartAsset AMP, a holistic client prospecting and marketing automation platform.
CFP® Exam Formula Sheet: What’s Included
The CFP Board lists the formulas you may encounter as you take the CFP exam, though it doesn’t offer an interpretation of them. Here are the formulas included in the March 2025 exam candidate handbook, along with an explanation of how they’re used.
Intrinsic Value
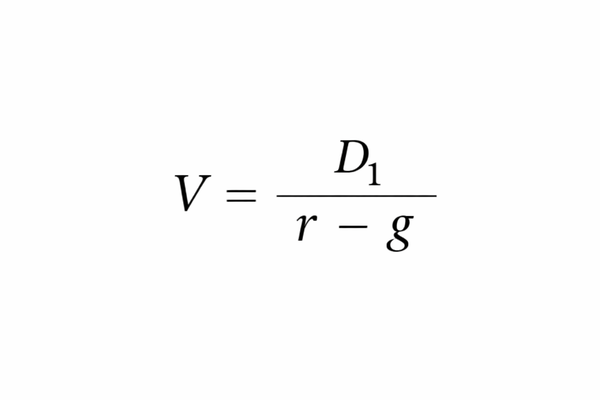
The intrinsic value formula calculates the value of a dividend-paying security, in dollar terms. Here’s what each variable means:
- D1 = next expected dividend
- r = the rate of return required by the investor
- g = the dividend growth rate or the company growth rate
Expected Rate of Return
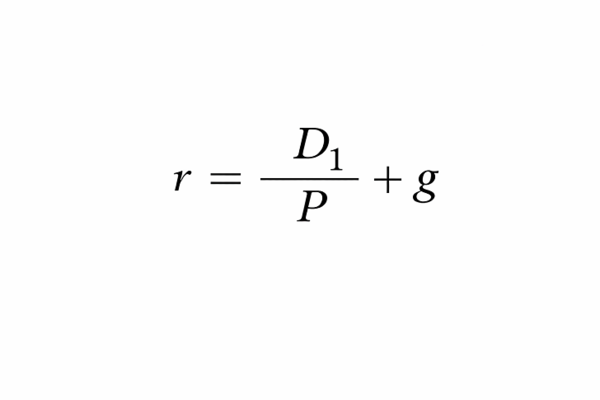
The expected rate of return formula tells you the rate of return an investor should expect based on the price they paid for a security. Here’s what each variable means:
- D1 = next expected dividend
- P = market price paid for a security
- g = the dividend growth rate or the company growth rate
Covariance
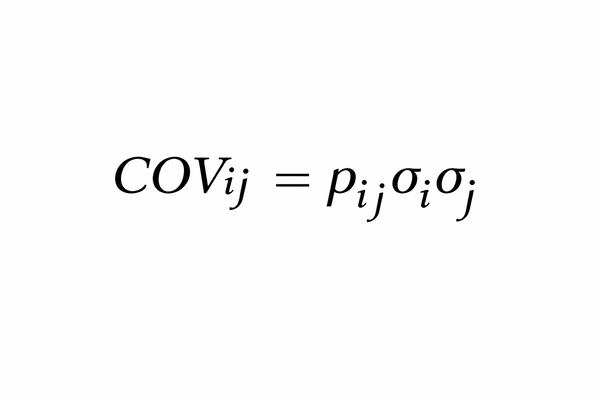
The covariance formula measures how one security behaves as a direct result of another. Here’s what each variable means:
- ρij = correlation between securities ‘i’ and ‘j’
- σi = standard deviation of security ‘i’
- σj = standard deviation of security ‘j’
Standard Deviation for a Two-Stock Portfolio
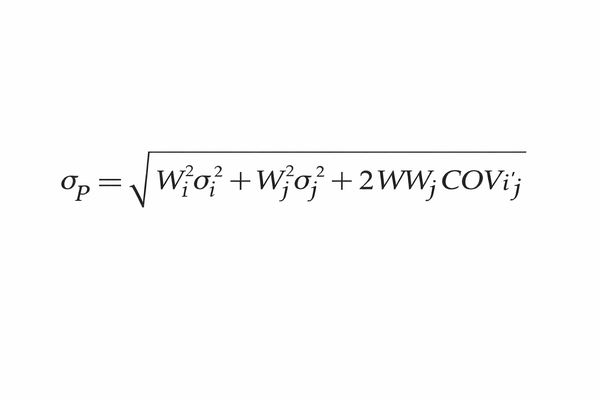
The portfolio deviation formula is used to calculate the standard deviation for a two-stock portfolio. Here’s what the variables mean:
- Wi = weight of stock ‘i’
- Wj = weight of stock ‘j’
- σi = standard deviation of stock ‘i’
- σj = standard deviation of stock ‘j’
- COVij = covariance between stock ‘i’ and ‘j’
Beta
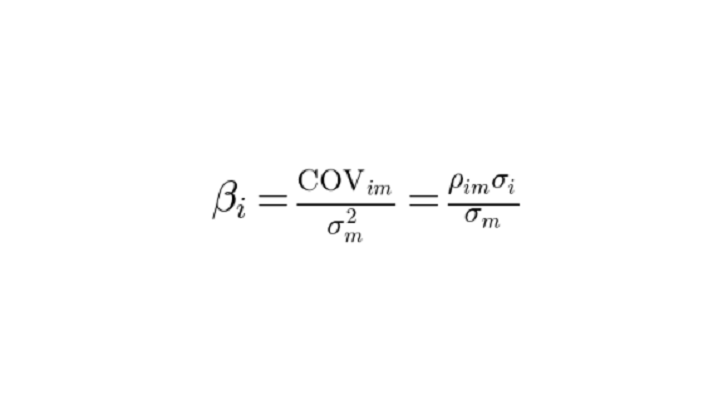
Beta is used to calculate risk as a measure of volatility, relative to the volatility of the market. In other words, beta measures how sensitive an investment’s returns are to movements in the overall market. Here’s what each variable means:
- σi = standard deviation of the individual security
- ρim = correlation between the individual security and the market
- COVim = covariance between an individual security and the market
- σm = standard deviation of market
Standard Deviation in a Population
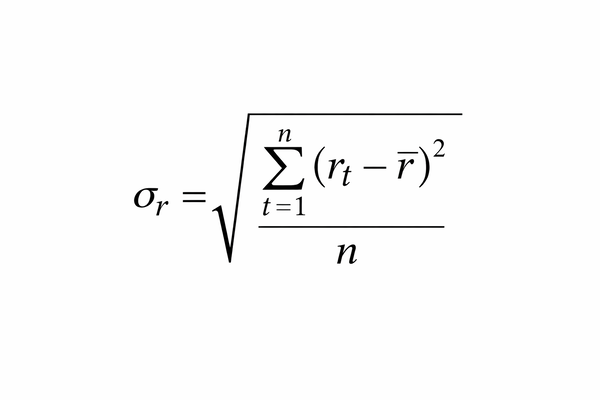
Standard deviation in a population is the deviation of a single security over a series of periods of returns. Here’s what each variable means:
- σr = standard deviation of results from the expected return
- Σ = summation of all terms
- n = number of periods being considered
- rt = actual return
- r = average return
Standard Deviation in a Sample
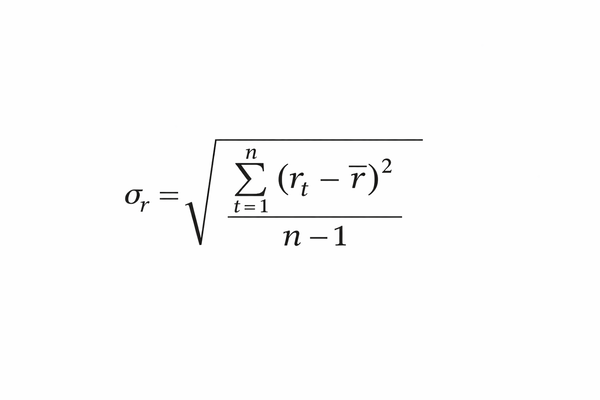
Standard deviation in a sample measures the deviation of a single security over a series of periods of returns. Here’s what each variable means:
- Sr = standard deviation of results from the expected return
- Σ = summation of all terms
- n = number of periods being considered
- rt = actual return
- r = average return
Capital Asset Pricing Model (CAPM)
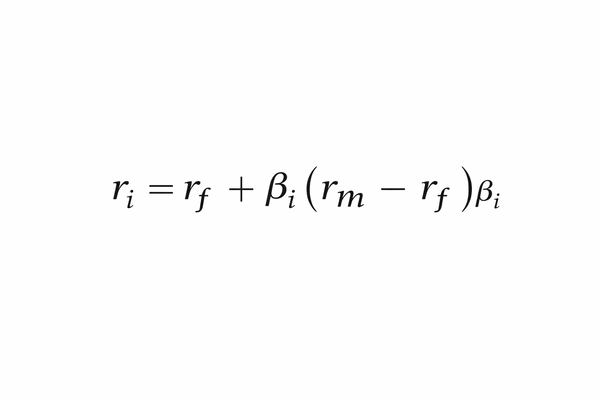
The capital asset pricing model estimates an investment’s expected return based on the risk-free rate, market return and the investment’s beta. Here’s what each variable means:
- ri = the investor’s required rate of return
- rf = risk free rate (the T-bill rate commonly serves this end)
- rm = return of the market (S&P 500 or some broad index)
- βi = beta of the security being measured for required return
Sharpe Ratio
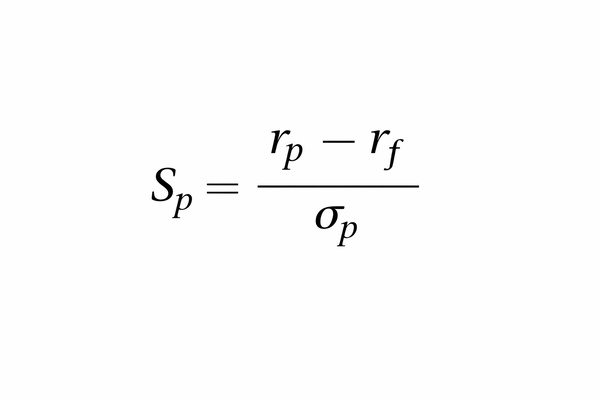
The Sharpe ratio measures how much excess return an investment generates for each unit of risk taken, helping investors compare risk-adjusted performance across different investments. Here’s what each variable means:
- Sp = Sharpe ratio
- rp = return of the portfolio
- rf = risk free rate of return
- σp = standard deviation of the portfolio being measured
Jensen’s Model
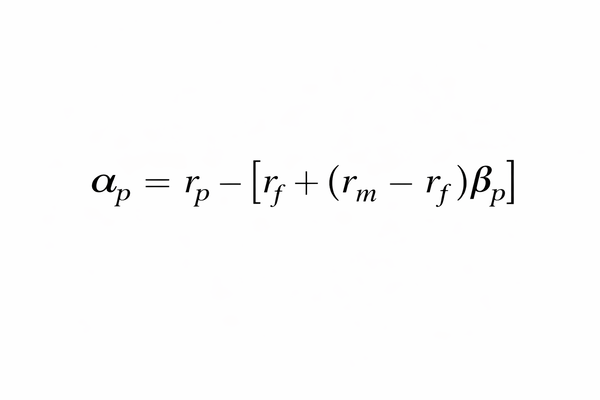
Jensen’s model, also known as Jensen’s Alpha, measures an investment’s actual return relative to its expected return under CAPM. Here’s what each variable means:
- αp = difference of return from amount required by investors
- rp = return of the portfolio
- rf = risk free rate of return
- rm = return of the market
- βp = beta of the portfolio being measured
Treynor Ratio
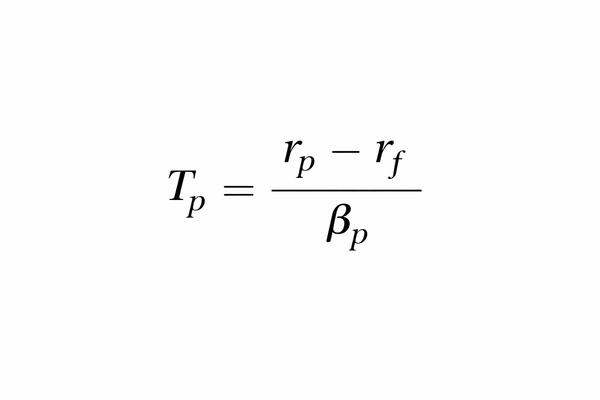
The Treynor ratio measures the performance of a portfolio manager. What’s the difference between the Treynor ratio vs. Sharpe ratio? Sharpe ratio uses standard deviation as the formula denominator, while the Treynor ratio uses beta. Here’s what each variable means:
- Tp = Treynor Index
- rp = return of the portfolio
- rf = risk free rate of return
- βp = beta of the portfolio being measured
Duration
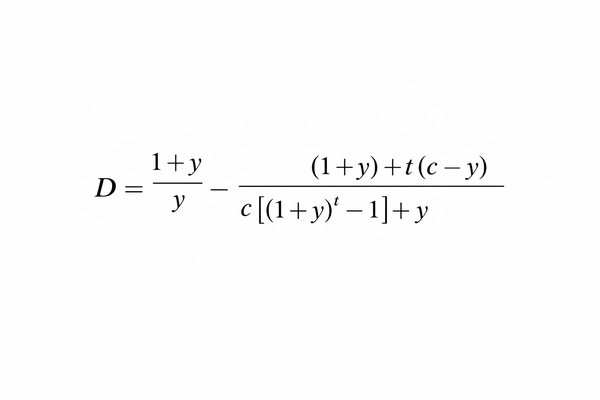
Duration measures a bond’s sensitivity to interest rate changes, expressed in years. Here’s what each variable means:
- y = Yield to maturity (as a %)
- c = rate of interest paid on the coupon
- t = number of periods to maturity
Change of Bond Price
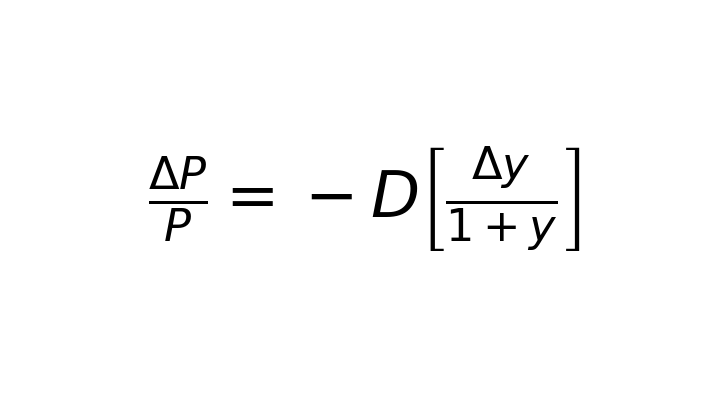
Change of bond price reflects the estimated change in price that will occur in a bond as interest rates increase or decrease. The resulting percentage change calculation is applied to price. Here’s what each variable means:
- ΔP = the dollar change in price
- P = price of a bond
- ΔP/P = % price change of bond
- (-D) = the duration in terms of years used as a negative value
- Δy = the % change in interest rates (this could be a negative number if rates decline)
- 1 + y = 1 + yield to maturity
Information Ratio
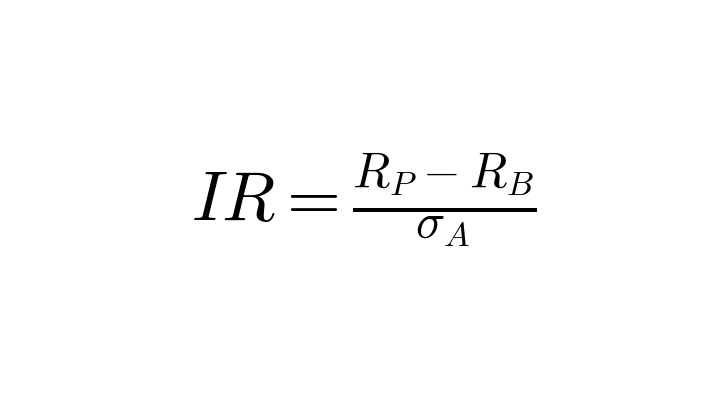
Information ratio is a measurement of returns above a benchmark, divided by standard deviation. Here’s what each variable means:
- RP = return of a portfolio
- RB = return of a benchmark
- σA = tracking error of active return
Effective Annual Rate
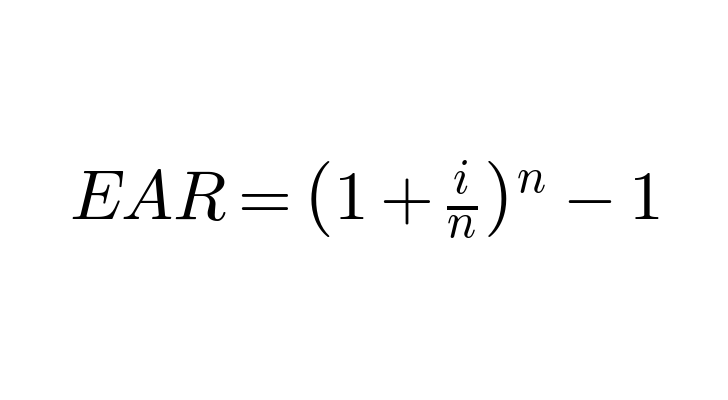
Effective annual rate represents the effective annual interest rate that’s earned on an investment when compounding happens more than once annually. Here’s what each variable means:
- i = stated annual interest rate
- n = number of compounding periods
Taxable Equivalent Yield
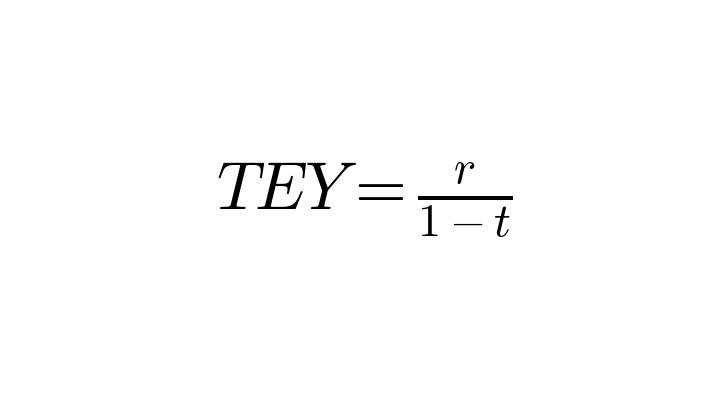
The taxable equivalent yield is the yield a taxable investment would need to match the return of a tax-exempt investment. Here’s what each variable means:
- r = tax-exempt yield
- t = investor’s marginal tax rate
Arithmetic Mean
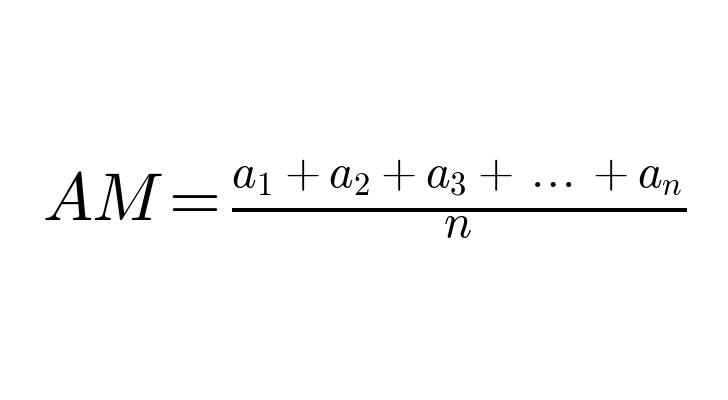
Arithmetic mean refers to the simple average. In this formula, the numerator variables (a1, a2, a3, etc.) are the return values to be averaged.
- n = number of periods
Geometric Average
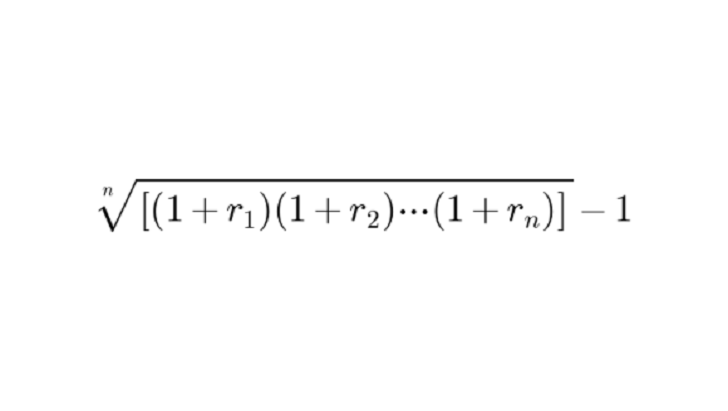
The geometric average formula calculates the rate of return where values and returns fluctuate from one period to the next. Here’s what each variable means:
- r = rates of return at various times
- n = number of periods
Unbiased Expectations Theory (UET)
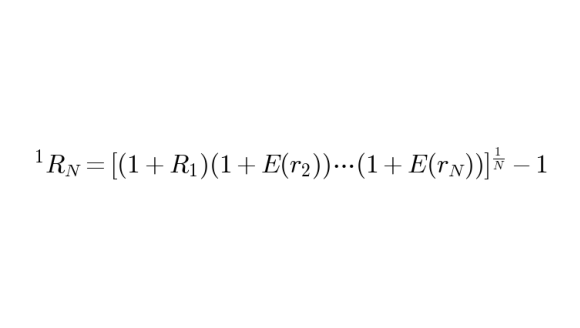
Unbiased expectations theory suggests that longer-term interest rates carry expectations about future short-term interest rates. Specifically, long term rates are geometric averages of current and expected future short-term rates.
Here’s what each variable means:
- 1RN = actual N-period rate today
- N = term to maturity
- 1R1=current one-year rate today
- E(ir1) = expected one-year rate at period i, where i = 1 to N
Holding Period Return
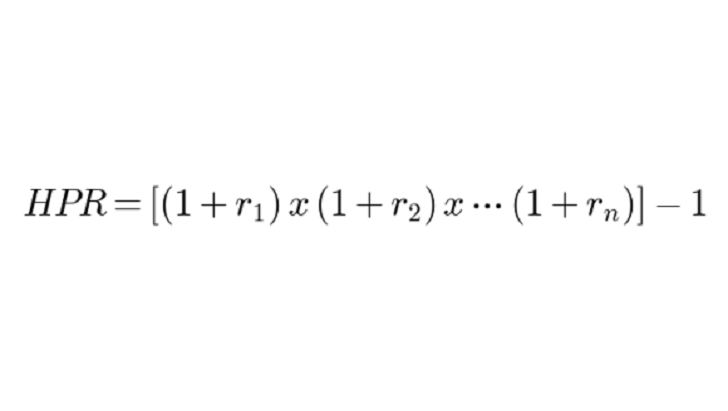
Holding period return is the total return of an investment over the period for which it’s held, including income and price changes. Here’s what each variable means:
- r = % return per period
- n = number of periods

Client Acquisition Simplified: For RIAs
- Ideal for RIAs looking to scale.
- Validated referrals to help build your pipeline efficiently.
- Save time + optimize your close rate with high-touch, pre-built campaigns.

CFP®, CEO
Joe Anderson
Pure Financial Advisors
We have seen a remarkable return on investment and comparatively low client acquisition costs even as we’ve multiplied our spend over the years.
Pure Financial Advisors reports $1B in new AUM from SmartAsset investor referrals.
How to Prepare for the CFP® Exam
The CFP® exam covers a broad range of financial planning topics and candidates are advised to give themselves plenty of time to study. According to the CFP Board, 80% of exam passers say they spent 11 or more hours per week preparing. 1
Reviewing the CFP® formula sheet is just one way to ready yourself for test day. Other strategies include:
- Investing in CFP® exam prep courses and materials
- Participating in an exam review session
- Taking CFP® practice exams that include sample questions
- Working with a study partner, which can encourage accountability in sticking to your study plan
- Looking into the CFP Board’s mentor program if you’d like one-on-one help with developing a study strategy
The CFP Board offers a host of resources to help you prepare for the exam. In November 2025, only 64% of candidates passed the CFP® exam, and since the exam was first offered in 1991, only 60% of those who have sat for it have passed. It’s worth exploring the tools that are available to ensure that you’re fully prepared.
Become a Top Financial Advisor
Referrals and market gains aren't enough. Grow with the all-in-one advisor marketing platform.

Bottom Line

Studying the CFP® formula sheet can give you a better understanding of the types of questions you might see on exam day. Completing some practice test questions that use these formulas can help you face them on the actual exam with a cool head.
Tips for Growing Your Advisory Business
- SmartAsset AMP (Advisor Marketing Platform) is a holistic marketing service financial advisors can use for client lead generation and automated marketing. Sign up for a free demo to explore how SmartAsset AMP can help you expand your practice’s marketing operation. Get started today.
- A CFP® mark is just one professional designation you might choose to earn. Some advisors are also Chartered Financial Analysts (CFA), Chartered Financial Consultants (ChFC) and Certified Investment Management Analysts (CIMA). Identifying the types of clients you mots want to serve can help you determine which certifications may prove most helpful.
Photo credit: ©iStock.com/YakobchukOlena, ©iStock.com/mapo
Article Sources
All articles are reviewed and updated by SmartAsset’s fact-checkers for accuracy. Visit our Editorial Policy for more details on our overall journalistic standards.
- “5 Habits of Successful Candidates.” CFP Board, https://www.cfp.net/candidate-tools-and-resources/5-habits-of-successful-candidates. Accessed 25 Feb. 2026.