 Written by
Don’t sleep on minor league baseball. Even some of the worst teams in the league manage to attract thousands of fans each season. Besides being able to find super-cheap tickets, the folks who attend minor league games get to root for teams with interesting names and wacky uniforms. To honor this sport’s die-hard fans, SmartAsset ranked the best minor league baseball cities and towns in America.
This is SmartAsset’s third annual ranking of America’s Best Minor League Baseball Towns. See the 2015 ranking here.
Study Specifics
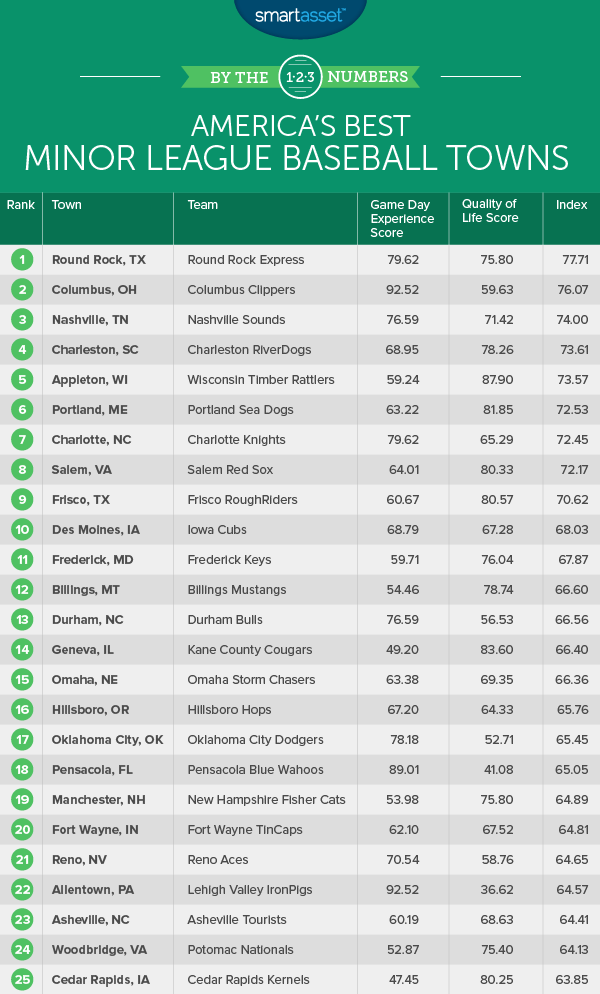
To create our list of the best minor league baseball towns in the country, we ranked 158 cities and towns using two scores: a quality of life score and a game day experience score. Each score was developed using the same nine metrics that we considered in the 2015 edition of our study.
Our quality of life score is based on the unemployment rate, property crime rate and violent crime rate in each town. We also looked at average discretionary income and the concentration of dining and entertainment establishments. To calculate our game day experience score, we focused on team records (aka the percentage of wins), minor league classes, stadium rankings and average attendance rates. (Read our full methodology below.)
Key Findings
- The East Coast dominates. Four of the top 10 minor league baseball towns are located off the coast of the Atlantic.
- Tennessee tanks. Nashville ranks third in our analysis this year. But three other Tennessee towns ranked at the bottom of the list. Kingsport, Greeneville and Elizabethton had some of the lowest game day experience and quality of life scores in our study.
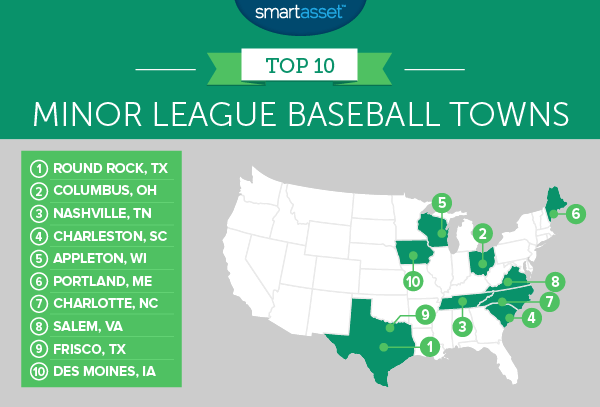
1. Round Rock, Texas (Round Rock Express)
For the second year in a row, Round Rock ranks as the country’s best minor league baseball town. The Round Rock Express had more regular season losses than wins in 2016, but fans filled the stands anyway. Average attendance for every game was 8,637. That’s 1.5% higher than it was in 2015.
Another reason why Round Rock takes the top spot in our ranking is the fact that it’s not a bad place to live. After paying for housing-related expenses – like property taxes and homeowners insurance – the average renter or homeowner ends up with $55,772 left over. So a typical Round Rock resident has more discretionary income than most of the people living in the other cities and towns in our analysis.
2. Columbus, Ohio (Columbus Clippers)
Columbus, Ohio and Allentown, Pennsylvania tied for the highest game day experience scores in our study. But Columbus pulled ahead in other factors. The Clippers’ regular season record for 2016 was nearly identical to their record for 2015. This year they won 82 games, which is more than most minor league teams.
One player that fans must’ve enjoyed watching was Yandy Diaz. The new outfielder and third baseman was named the International League Rookie of the Year. He ended the season with a .462 batting average.
3. Nashville, Tennessee (Nashville Sounds)
The Nashville Sounds had one of the best regular seasons in the league. They won 58.5% of their games, up from 45.8% last year. That kind of progress is enough to make you want to move to Nashville, right?
If not, think about this: The city has the fourth highest concentration of dining and entertainment establishments in our entire study. That means once you leave the baseball stadium, you’ll have a number of bars and restaurants to choose from.
Related Article: What Is the Cost of Living in Tennessee?
4. Charleston, South Carolina (Charleston RiverDogs)
The Charleston RiverDogs recently agreed to extend their partnership with the Yankees through 2020. So we can expect to see more RiverDogs heading to New York in the future.
The Low Class-A team made it to the playoffs for the first time since 2005. They also broke their attendance record. Reportedly, 293,161 fans attended games this past season.
5. Appleton, Wisconsin (Wisconsin Timber Rattlers)
After falling out of the top 10 last year, Appleton is back and ranked the fifth best minor league baseball town – the same spot it held in 2014. Before changing their name to the Timber Rattlers, the Appleton Foxes had an affiliation with the Seattle Mariners in the ’90s. Legendary (and controversial) player Alex Rodriguez actually played for the Foxes before being promoted to the Mariners’ major league team.
6. Portland, Maine (Portland Sea Dogs)
After a rough season last year, the Sea Dogs weren’t able to bounce back in 2016. But that didn’t deter the team’s true fans. Portland averaged 5,354 fans per game, filling their stadium to 72.7% capacity.
About 39% of Maine’s residents live in the Portland metro area, according to 2014 data from the U.S. Census Bureau. In addition to having 30 dining and entertainment establishments per 10,000 people, the city of Portland has a strong economy. Its 3% unemployment rate is the lowest in our analysis. Springdale, Arkansas (which ranks 46th) also has a 3% unemployment rate, according to the Bureau of Labor Statistics.
7. Charlotte, North Carolina (Charlotte Knights)
The Charlotte Knights ended their regular season with a 64-79 record. Even though they won just 45% of their games, fans turned out in droves and filled their stadium to 88% capacity. And here’s something else Knights fans can be proud of: In a ranking of the best minor league baseball stadiums in the country, their stadium placed sixth.
8. Salem, Virginia (Salem Red Sox)
The Salem Red Sox had an exciting regular season this year. They won 87 games and had the best record of all the teams in the Carolina league. But their hopes of clenching the championship title fell short when they lost to the Myrtle Beach Pelicans.
9. Frisco, Texas (Frisco RoughRiders)
The median household income in Frisco, Texas is $112,155. After paying for housing-related expenses, residents, on average, have $90,579 left to spend on other items. Essentially, the typical Frisco resident has more money at their disposal than their counterparts in every other city and town in our analysis.
The RoughRiders’ regular season record was so-so. Nevertheless its attendance numbers were impressive. Overall, it drew bigger crowds than any other minor league team at the AA level.
10. Des Moines, Iowa (Iowa Cubs)
Since 2015, Des Moines has fallen in the rankings on our list of the best minor league baseball towns. The Cubs won only 47% of their games during this year, finishing off the season with a worse record than expected.
But fans still showed support. Average attendance increased by 0.4% since last year. About 7,414 people attended each game (on average), filling the Cubs’ stadium to 64.5% capacity.
Methodology
SmartAsset decided that the best towns for minor league baseball would provide fans with a great game day experience and a high quality of life. So we developed a game day experience score and a quality of life score by ranking 158 cities and towns across the following nine metrics:
Game Day Experience Factors:
- Each team’s percentage of wins during the 2016 season
- Stadium rankings (using the 2015 ranking from the Stadium Journey website)
- Average attendance rates (attendance averages divided by stadium capacity)
- Each team’s minor league class (the ones in the AAA category are the best, followed by the AA, High A, Low A, Class A Short and Rookie teams)
Quality of Life Factors:
- Property crime rate (the number of property crimes per 100,000 people)
- Violent crime rate (violent crimes per 100,000 residents)
- Unemployment rate
- Median discretionary income (median annual household income minus annual housing costs)
- Dining and entertainment businesses per 10,000 people
We used the same factors that we considered in our 2015 analysis. This year, we excluded the Hartford, Connecticut Yard Goats since their stadium was under construction and they didn’t play any home games in 2016. One additional note: Since the Columbia, South Carolina Fireflies played in a new stadium this past season (meaning that it wasn’t included in the Stadium Journey ranking), we gave them an average ranking overall.
Once we ranked each team and town according to each factor, we averaged those rankings and created separate indexes for our game day experience score and our quality of life score. Then we averaged the scores from both indexes, giving equal weight to each one.
Data Sources
Our 2016 team win percentages come from baseballamerica.com and milb.com. Our attendance data also comes from milb.com. Data on stadium capacity is based on 2016 numbers from baseballpilgrimages.com.
Property crime and violent data come from the FBI’s Uniform Crime Reporting database and local police department websites. We didn’t have 2014 crime data for all of our cities and towns so we filled some holes with 2013 data. If neither was available, we used the average from all the cities in the study.
The unemployment rate is based on Bureau of Labor Statistics data for June 2015 – June 2016. Data on annual household income and housing costs come from the U.S. Census Bureau’s 2014 five-year American Community Survey. Data on dining and entertainment establishments comes from the 2014 edition of the Census Zip Business Patterns.
The data analysis for this study was completed by Nick Wallace.
Questions about our study? Contact press@smartasset.com
Photo credit: ©iStock.com/Marcio Silva