 Written by
In the wake of the housing crisis last decade, homeownership rates declined markedly. In 2005, more than 69% of American households owned the home they lived in. Today that rate is just 64%. The decline has been especially steep among young homeowners. At the end of 2015, less than 35% of adults under the age of 35 owned their home.
This is SmartAsset’s second annual study of the best cities for first-time homebuyers. Read the 2017 version here.
It isn’t just mistrust of a volatile market that has driven young adults away from home buying. Mortgage lending practices have been tightened since the crisis, which means young people with shorter credit histories may find it harder to get a mortgage.
Another problem is affordability. Prices have now rebounded beyond their pre-recession peaks, while wages in much of the country have not shown the same growth. That can make it hard for some would-be homeowners to afford an adequate down-payment or monthly mortgage payments.
Buying a home? Compare mortgage offers with SmartAsset’s free tool.
These problems are more pronounced in some areas than others. For example, the most expensive housing markets can be found in clusters on the West Coast and in the Northeast. Likewise, mortgage accessibility varies greatly depending on location.
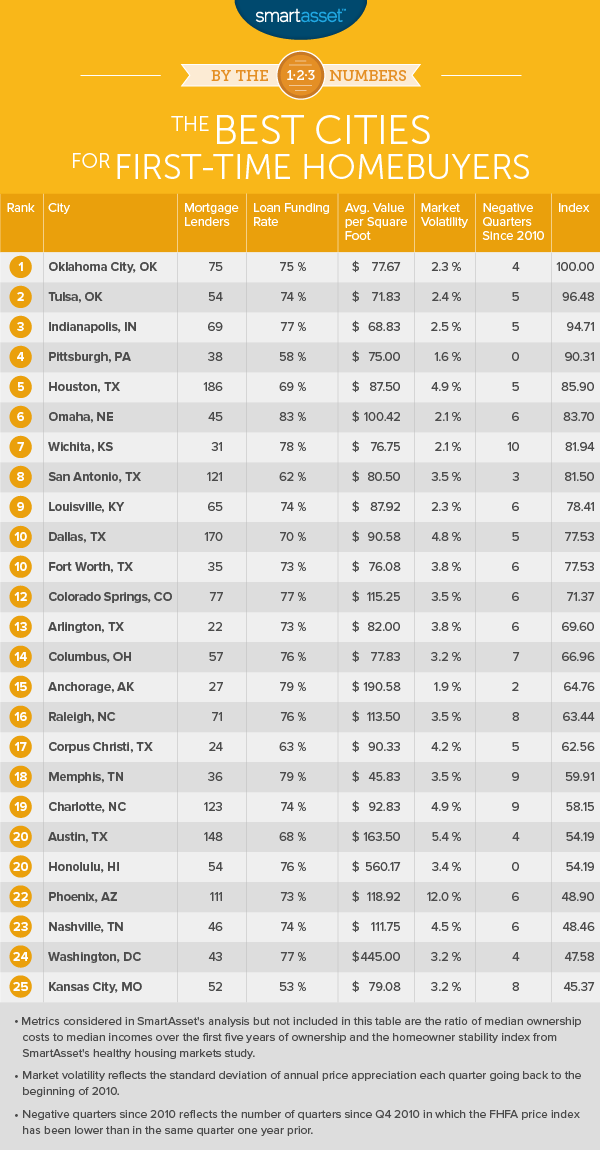
To find the best cities for first-time homebuyers, SmartAsset looked at data on the affordability, mortgage availability and the stability of the housing market in every U.S. city with a population of more than 300,000. We considered metrics such as the number of HUD-approved lenders, the value per square foot of residential real estate and the volatility of price changes over the past five years. (Read more about our methodology below.)
Key Findings
- Oklahoma and Texas are best buys. Five of the top ten cities for first-time homeowners are located in these two states. Oklahoma’s two largest cities claim the top two spots.
- West Coast is priced out. Largely as a result of high prices, zero West Coast cities rank among the top 25 best for first-time homebuyers. The bottom seven cities in SmartAsset’s analysis are all located in California.
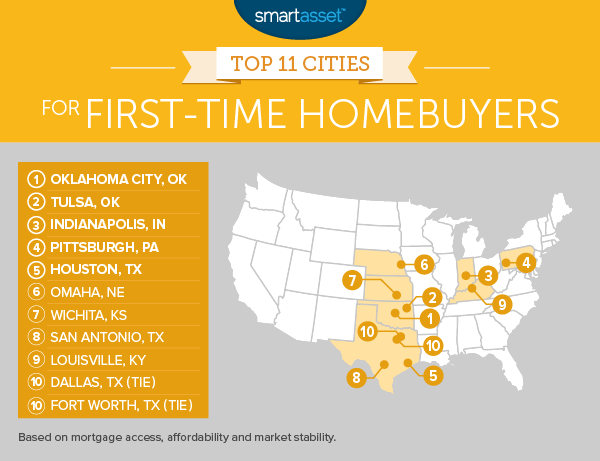
1. Oklahoma City, Oklahoma
The largest city in the Sooner State, Oklahoma City rated especially well for its affordability and market stability. According to data from Zillow, the average value per square foot of residential real estate in Oklahoma City is just $77.67, 10th lowest among the 66 U.S. cities with a population of at least 300,000. That means first-time homebuyers may have an easier time finding a home that is within their budget.
At the same time, the market in Oklahoma City has been among the most stabile over the past four years. The quarterly FHFA home price index for Oklahoma City has declined (on a year-over-year basis) on just four occasions since 2010, the fifth-lowest number of any city in SmartAsset’s analysis.
Buying a home? Find out what your mortgage payment will be with SmartAsset’s mortgage calculator.
2. Tulsa, Oklahoma
Tulsa is a smaller and somewhat more affordable market than Oklahoma City. While it has fewer mortgage lenders than the Oklahoma capital (54 as compared with 75) the price of property is lower. The value per square foot in Tulsa is $71.83, fifth lowest of America’s largest cities.
3. Indianapolis, Indiana
Among major cities, Indianapolis is the nation’s second-most affordable real estate market. Only Detroit has a less expensive homebuying market. Yet while Detroit rates poorly on metrics such as market stability and mortgage availability, Indianapolis rates quite well. In fact, it has the nation’s seventh-highest loan funding ratio, at 77%. Likewise, with just five negative quarters since 2010, Indianapolis rates as the eighth-best city for that metric.
4. Pittsburgh, Pennsylvania
Steel City once again ranks among the top five cities for first-time homeowners after another 12 months of incredible market stability. Along with Honolulu, Pittsburgh is one of just two major U.S. cities in which there have been no year-over-year quarterly price declines since 2010, according to FHFA data. That type of price stability can ease the stress on new homeowners who are still getting comfortable with the other demands of homeownership.
5. Houston, Texas
Houston has more HUD-approved mortgage lenders than any other U.S. city, with 186. (In contrast, HUD lists just 67 such lenders in New York City.) That means Houston residents have more options when it comes time to shop for a mortgage.
6. Omaha, Nebraska
According to data from the Mortgage Bankers Association, Omaha has the highest loan funding ratio of any major U.S. city. In 2014, there were 6,199 applications for conventional non-jumbo loans in Douglas County, Nebraska (in which Omaha is located) versus 5,173 loan originations. That’s a funding ratio of 83%. The average for major U.S. cities is 69%.
7. Wichita, Kansas
The top-ranked city in last year’s analysis, Wichita again ranks among the top 10 best cities for first-time homeowners. It rated very highly for affordability, with an income-to-housing-costs ratio that ranks second among major U.S. cities.
It likely would have rated number one or two again this year, but with 10 negative quarters since 2010 the Wichita housing market rated below average for that metric. Price growth has exceed 3% over the past year, however. (Note: SmartAsset did not include the quarterly growth rate as a metric in last year’s analysis.)
8. San Antonio, Texas
The housing market in San Antonio has been booming over the past several years. According to FHFA data, prices increased 8% from the third quarter of 2014 to the third quarter of 2015. Price growth has been consistently positive since the end of 2011.
Yet it remains highly affordable, which is key for first-time homebuyers who are working with a limited budget. The value per square foot in San Antonio is $80.50. For comparison, the price in the nation’s most expensive market (San Francisco) is $855.75.
9. Louisville, Kentucky
Located along the Indiana-Kentucky border, Louisville is the economic and cultural capital of the Bluegrass State. It ranks as a top ten city for first-time homebuyers for the second year in a row. It is also a good destination for young people who are interested in starting a business, as it has some of the country’s lowest business startup costs.
10. Dallas, Texas and Fort Worth, Texas
These two next door neighbors jointly rank as the tenth best cities for first-time homeowners. Both have experienced a high degree of home price appreciation in recent years. Prices in the Dallas metro area increased by 11% between the third quarter of 2014 and the third quarter of 2015, according to the FHFA.
In Fort Worth, which is a smaller but somewhat more affordable market than Dallas, appreciation was 9% over that same period. If that trend continues, new homeowners will be able to accumulate equity more quickly.
Methodology
Our analysis considered every U.S. city with a population of at least 300,000. For those cities, we considered the following seven metrics, reflective of the mortgage accessibility, affordability and stability in each market.
- Total number of HUD-approved mortgage lenders. Data from HUD.
- Loan funding ratio. This is the number of conventional non-jumbo loans originated in 2014 as a percentage of conventional non-jumbo loan applications. Data is at the county level, for the county in which each city is located, and comes from the Mortgage Bankers Association.
- Value per square foot of residential real estate. We calculated an average 2015 number based on monthly data from Zillow.
- Affordability ratio. This is the ratio of median household income over five years to ownership costs over five years, including such things as closing costs, mortgage payments, insurance and taxes. Data comes from the U.S. Census Bureau, Bankrate and the National Association of Insurance Commissioners.
- Homeowner stability. This metric comes from SmartAsset’s healthiest housing markets study. It incorporates the number of homeowners with negative equity and the number of years homeowners remain in their homes, giving equal weight to each. Calculations based on data from Zillow and the U.S. Census Bureau.
- Market volatility. This is the standard deviation of quarterly year-over-year housing price appreciation from the beginning of 2010 to the third quarter of 2015 (the most recent quarter for which data is available). Data is at the metro area level and comes from the Federal Housing Finance Agency.
- Negative quarters since 2010. The number of quarters since the fourth quarter of 2010 in which home prices declined on a year-over-year basis. Data is at the metro area level and comes from the Federal Housing Finance Agency.
We ranked each city in our analysis according to these seven metrics. We then averaged those rankings, giving equal weight to each metric. The overall index was determined by those average rankings. The city with the best overall average scored a 100 on the index.
Questions about our study? Contact us at press@smartasset.com.
Photo credit: ©iStock.com/Louis-Paul St-Onge