 Written by
  Census Bureau data from 2018 shows that millennials have a homeownership rate of 33.7%, well below the national average of almost 64%. Though the national rate of millennial homeownership is low, some cities have much higher rates of millennial homeownership that come closer to the national average.
In this study, we looked at where millennials are buying homes by considering both where millennial homeownership rates are currently high as well as where homeownership rates for residents younger than 35 have been increasing in recent years. Specifically, we compared data from 200 of the largest cities in the U.S. according to two metrics: the current rate of millennial homeownership and the 10-year change in under-35 homeownership rate. For details on our data sources and how we put all the information together to create our final rankings, check out the Data and Methodology section below.
This is SmartAsset’s fifth annual study on where millennials are buying homes. Read last year’s version here.
Key Findings
- Millennial homeownership rates are higher in the West. Seven of the top 10 cities in our study are in the West, with two in Arizona, four in California and one in Alaska. All seven cities have millennial homeownership rates that rank in the top 20% of cities in our study.
- Under-35 homeownership rates are declining. Over the past 10 years, the national homeownership rate for people between the ages of 18 and 34 has fallen by roughly 3% from about 36.5% in 2009 to about 33.7% in 2018. In fact, the under-35 homeownership rate has declined in 152 of the total 200 cities in our study over that period.
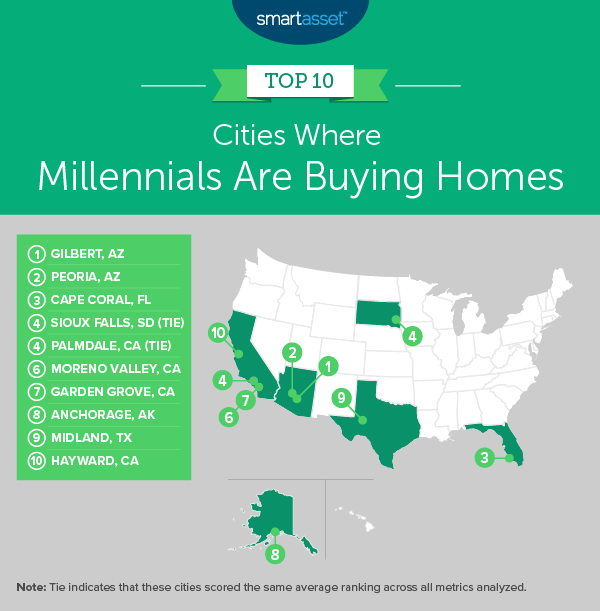
1. Gilbert, AZ
Over the past year, millennials in Gilbert, Arizona have increasingly bought homes. Census data from 2017 shows that millennials had a homeownership rate of about 51% while more recent data from 2018 shows that the homeownership rate for residents younger than the age of 35 was 56.56%, the third-highest of all 200 cities in our study. As a result, Gilbert moved up significantly from its ranking in last year’s study, where it did not make it into the top 25. Beyond ranking third for its high rate of current millennial homeownership, Gilbert has the second-highest 10-year change in under-35 homeownership rates, with a 9.17% increase between 2009 and 2018.
2. Peoria, AZ
About six in 10 millennials in Peoria, Arizona own a home, the highest rate of 2018 millennial homeownership in our study. Additionally, the metro area has the fifth-highest increase of under-35 homeownership over the past 10 years across all 200 metro areas overall. Between 2009 and 2018, the homeownership rate for households headed by someone under the age of 35 rose by 8.46%.
3. Cape Coral, FL
Cape Coral, Florida is home to many millennials who are choosing to buy rather than rent. Millennials had a 2018 homeownership rate of 55.81%, the fourth-highest of any city in our study. Additionally, data from the past 10 years shows that homeownership rates for residents younger than 35 are trending upward, rising by almost 9% between 2009 and 2018.
4. Sioux Falls, SD (Tie)
Sioux Falls, South Dakota ranks in the top 5% of cities for both metrics, 10-year change in the homeownership rate for residents younger than 35 and 2018 millennial homeownership rate. Between 2009 and 2018, the under-35 homeownership rate there increased by about 8% to 48.83%.
4. Palmdale, CA (Tie)
Palmdale, California ties with Sioux Falls for the No. 4 spot in our study on where millennials are buying homes. Over the past 10 years, homeownership rates for people in Palmdale who are younger than 35 have increased by 10%, the highest uptick of city in our study. Palmdale also ranks in the top 10% of cities for its current millennial homeownership rate, 45.71%.
6. Moreno Valley, CA
Part of the San Bernardino-Riverside metro area, Moreno Valley, California had a millennial homeownership rate of 48.22% in 2018, about 15% higher than the national average and the ninth-highest rate for this metric in our study. Over the past 10 years, the under-35 homeownership rate has increased by 4.42%, the 11th-highest rate across all 200 cities we looked at.
7. Garden Grove, CA
The 2018 median home value in Garden Grove, California, $594,400, is the second-highest figure of any city in our top 10 and the 23rd-highest of all 200 cities in our study. Despite this, between 2009 and 2018, the homeownership rate for residents under the age of 35 there increased by 8.8%, the fourth-highest increase overall. As a result, the 2018 millennial homeownership rate was 35.05%, almost 1.5% higher than the national average.
8. Anchorage, AK
Between 2009 and 2018, the homeownership rate for people younger than 35 rose by 3.11% in Anchorage, Alaska. As a result, close to 10,000 of the almost 26,000 of the households headed by someone in that age group, or 37.73%, were owner-occupied in 2018.
9. Midland, TX
Midland, Texas has had the slowest growth in under-35 homeownership of any city in our top 10, at 2.64% over the past 10 years, but still ranks in the top 15% of cities on both metrics we considered. The 2018 homeownership rate for residents under the age of 35 was 37.94%, higher than the national average of 33.7% in 2018.
10. Hayward, CA
Home values are the highest in Hayward, California of any city in our top 10. In 2018, the median home value in Hayward was $638,600, the 19th-highest of all 200 cities in our study. However, despite cost, the homeownership rate for residents younger than 35 has increased by 4.10% over the past 10 years, the 13th-highest uptick overall.

Data and Methodology
To find the cities where millennials are buying homes, SmartAsset examined data for 200 of the largest cities in the U.S. We considered two metrics:
- 2018 millennial homeownership rate. This is the percentage of millennial households who own their homes. For this study, we defined millennials as those under the age of 35. Data comes from the U.S. Census Bureau’s 2018 1-year American Community Survey.
- 10-year change in under-35 homeownership rate. This is the percentage change in the homeownership rate among 18- to 34-year-olds from 2009 to 2018. Data comes from the U.S. Census Bureau’s 2009 and 2018 1-year American Community Surveys.
First, we ranked each city in both metrics. Then we found each city’s average ranking and used the average to determine a final score. The city with the highest average ranking received a score of 100. The city with the lowest average ranking received a score of 0.
Tips for Millennial Homebuyers
- Make sure buying is the right decision. When you’re moving to a new city, you need to decide if you are going to rent or buy. If you are coming to a city and plan to stay for the long haul, buying may be the better option for you. On the other hand, if your stop in a new city will be a short one, you’ll likely want to rent. Our rent vs. buy calculator can help you map out the trade-offs between the two and see whether it is better to rent or buy given your specific financial circumstances.
- Make sure you can handle a mortgage. A mortgage is a big commitment, so be certain you’ll be able to afford whatever you’ll end up having to pay. Use SmartAsset’s mortgage calculator to see the ideal range in which you should be shopping.
- Consider a financial advisor. Buying a home is a major commitment, and talking to a financial advisor before you buy may help in terms of planning. Finding the right financial advisor that fits your needs doesn’t have to be hard though. SmartAsset’s free tool matches you with financial advisors in your area in just five minutes. If you’re ready to be matched with local advisors that who help you achieve your financial goals, get started now.
uestions about our study? Contact us at press@smartasset.com
Photo credit: ©iStock.com/monkeybusinessimages