 Written by
Is the American Dream making a comeback? After the housing crisis last decade, many people questioned the legitimacy of homeownership as a means of building wealth and providing economic security. Today, however, with home prices in much of the U.S. at last passing their pre-crisis peak and mortgage rates hovering near their historic lows, for many homeownership seems attractive once again.
Thinking about buying a home? See what your mortgage payment will be with SmartAsset’s mortgage calculator.
On the other hand, homeownership is just one piece of the American Dream. While there’s no concrete definition of the term, most people would say that economic opportunity is also an important consideration. On that measure, with middle-class wages stagnant and income inequality at a record high, the Dream is perhaps not doing as well.
A lot of this depends on where you live. Now more than ever, some parts of the country are doing very well while others struggle to keep up. Likewise, while housing markets in some cities have become too expensive for the average homebuyer, in other places housing remains quite affordable.
So where are the best cities for living the American Dream? To answer that question, SmartAsset looked at five different measures of housing and opportunity in 250 of the largest American cities.
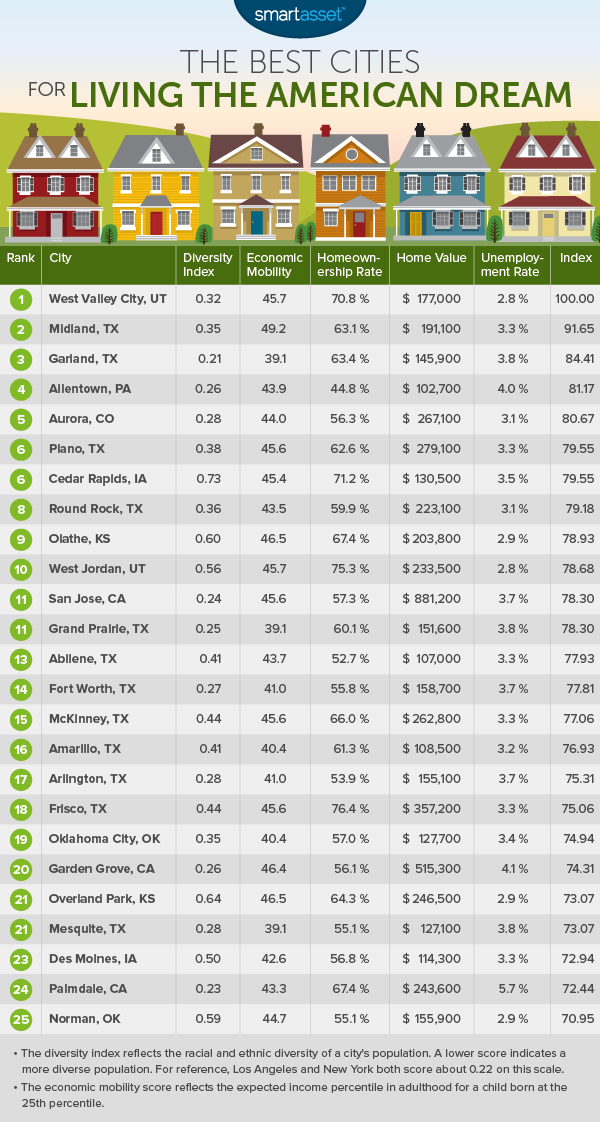
Specifically, we considered the following metrics: homeownership rate, median home value, racial and ethnic diversity, unemployment and intergenerational economic mobility. (Our full methodology and data sources can be found at the end of the article.)
Key Findings
- High homeownership rates in Texas. Twelve Texas cities rate in the top 25. These cities have high homeownership rates and housing markets that remain more affordable than those of most U.S. cities.
- Is the Dream still alive on the East Coast? Allentown, Pennsylvania is the only East Coast city to rate among the top 25. In general, the housing markets on the East Coast are more expensive than those in other parts of the country.
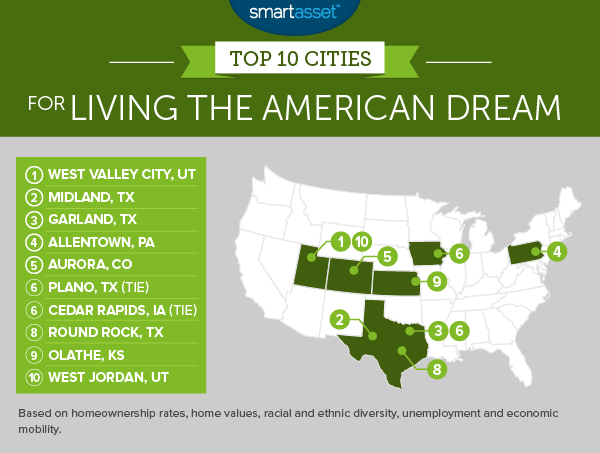
1. West Valley City, Utah
Located southwest of Salt Lake City, West Valley City is the second largest city in Utah and it is growing quickly. The present population of nearly 135,000 represents an increase of more than 25,000 residents since the year 2000. Nonetheless, it has one of the highest homeownership rates in the country, with 70.8% of West Valley City residents owning their home. That’s 11th highest of the 250 cities SmartAsset’ considered.
The city also rates well for its level of economic mobility. According to researchers at Harvard, a child born to parents in the West Valley City area whose income places them in the 25th percentile nationally could on average expect to climb to the 45th percentile as an adult. That’s the 18th highest level of intergenerational mobility of any city in our study.
2. Midland, Texas
This west Texas city has one of the country’s highest levels of intergenerational mobility. A person born in the bottom quartile of families in Midland can expect to rise almost to the national median. That gives it the second highest intergenerational mobility rating of any city in our analysis.
The city’s economy is largely driven by the region’s large energy sector, and oil extraction in particular. While the unemployment rate in Midland is just 3.3%, the housing market remains more affordable than the national average. The median home value in Midland was $191,100 as of January 2016.
Moving to Texas? Find out what your property tax rates will be.
3. Garland, Texas
The American Dream should be accessible to people of all backgrounds, and in Garland, it our data shows that it is. Garland is one of the most diverse cities in the United States, with no racial or ethnic group making up more than 33% of the population.
Overall, Garland’s diversity index score of 0.209 reflects a population that is slightly more diverse than that of Los Angeles or New York City. It rates as the 10th-most diverse city in SmartAsset’s analysis. Meanwhile, it has a homeownership rate of 63.4% and a median home value $145,900.
4. Allentown, Pennsylvania
While the homeownership rate in Allentown is lower than that of many other top cities on this list, that may have more to do with the city’s age demographics than its housing market. While just 12.2% of the population is over the age of 65, 23.5% is between 20 and 35 years old. (Younger adults are less likely to own a home.)
In fact, the city’s housing market is very affordable. The median home value of $102,700 makes it the 28th most affordable market of the 250 cities in our analysis.
5. Aurora, Colorado
The Denver metro area has been booming in recent years and Aurora has been a big part of that boom. The city’s population has increased by more than 75,000 residents since 2000, to a little over 350,000. With unemployment in the Aurora area at just 3.1% and homeownership at 56.3%, the city can be an attractive destination for people seeking economic opportunities and the possibility of owning their own home.
Find out now: Is it better to rent or buy?
6 (tie). Plano, Texas
Of the 250 cities in SmartAsset’s analysis, Plano boasts the 24th-highest level of economic opportunity. Researchers at Harvard’s Equality of Opportunity project found that in Plano a child born to parents in the 25th percentile of income earners could expect to rise to the 45th percentile as an adult.
6 (tie). Cedar Rapids, Iowa
This mid-sized Iowa city ranks as a top area for living the American Dream on the strength of its high homeownership rate. Over 71% of households in Cedar Rapids own the home they live in, according to U.S. Census Bureau data. That ranks 10th out of the 250 cities in our study. Cedar Rapids also rates as the best city in America for children, in part as a result of its high level of intergenerational mobility.
8. Round Rock, Texas
Round Rock is located in central Texas and is part of the Austin metropolitan area. It has very low unemployment, at just 3.1%. Nearly 60% of Round Rock residents own their home.
9. Olathe, Kansas
With a population of just over 133,000, Olathe is the fourth-largest city in Kansas. It has one of the highest rates of intergenerational mobility of any major U.S. city, ranking eighth out of the 250 cities in our study for that measure. It also rates quite well for homeownership, a staple of the American Dream. More than 67% of families in Olathe own the home they live in.
10. West Jordan, Utah
The homeownership rate in West Jordan, which is located south of Salt Lake City, is 75.3%. Out of the 250 cities in SmartAsset’s study, that ranks as the third highest.
Meanwhile, unemployment in Salt Lake County, in which West Jordan is located, is just 2.8%. If the American Dream consists of owning a home and having a job, West Jordan can be a great place to achieve it.
Methodology
As described above, SmartAsset’s analysis focused on five metrics: the homeownership rate, median home value, racial and ethnic diversity, unemployment and intergenerational economic mobility. While the homeownership rate, home value and unemployment rate are all relatively self-explanatory, the other two measures merit further explanation.
To gauge intergenerational mobility we used a county-level statistic developed by researchers at Harvard’s Equality of Opportunity project. Specifically, we looked at the expected income percentile for children whose parents are in the 25th percentile – that is, the bottom quarter of earners. If this measure is 50, it reflects an area in which being born poor has essentially no effect on your economic prospects. Lower numbers reflect a lower level of opportunity.
We also wanted to incorporate diversity into our analysis. To compare diversity between cities, we calculated a score based on population percentages of eight different racial and ethnic groups measured by the U.S. Census Bureau.
The score we calculated is a variation of the Herfindahl–Hirschman Index used to measure market concentration. With this measure, a lower number reflects a more diverse population. A city in which a single racial or ethnic group makes up 100% of the population would score a 1.00 on this measure, while a city in which each group account for 12.5% of the population would score a .125.
To calculate the overall index score, we ranked each city according to those five metrics. We then averaged those rankings, weighting each metric evenly. The index score was determined by those averages. The city with the best average ranking scored a 100.
Data on the homeownership rate comes from the U.S. Census Bureau. Data on unemployment comes from the Bureau of Labor Statistics and is at the county level. Data on home values is for January, 2016, and comes from Zillow.
Photo credit: ©iStock.com/DanielBendjy