 Written by
Many American cities are facing a housing supply crunch. Housing costs, especially in urban centers, are on the rise, and in cities like New York and Los Angeles large swaths of the population find themselves severely housing cost-burdened. People often want to live in places which offer the best value but when it comes to comparing different cities, it can be hard to determine which cities offer the most bang for your buck. Below SmartAsset compares quality of life factors and home prices to find the most undervalued cities.
Compare current mortgage rates here.
In order to find the most undervalued cities in the country, Smart Asset created a model to project each city’s price per square foot based exclusively on livability metrics, and compared it to the actual price per square foot. We used eight metrics to measure livability. These include the unemployment rate, crime rate, high school graduation rate, number of entertainment and dining establishments and walkability. For the full list of metrics and how we created our model, read our data and methodology section.
This is our second annual study of these most undervalued cities in America, check out the 2016 version here.
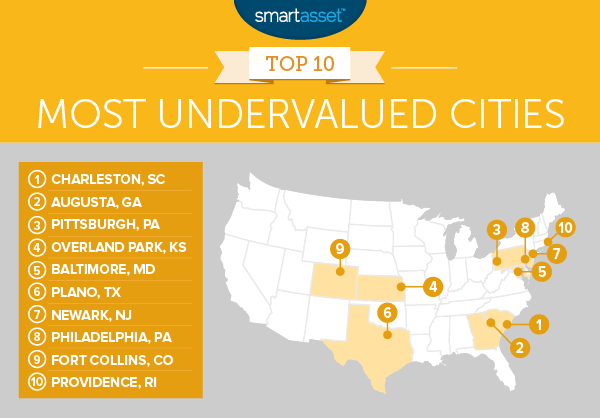
Key Findings
- Two newcomers – Fort Collins, Colorado and Augusta, Georgia cracked this year’s top 10, after finishing 11th and 170th, respectively, last year.
- Big cities are overvalued – The biggest cities in the country tend to be the most expensive and residents living in them don’t get the most bang for their buck. Washington D.C., Boston, San Francisco and San Jose, California are in the bottom 15. New York ranks 172nd.
- If you had a million (or a billion) dollars… – If you had no budgetary concerns and only wanted to maximize quality of life, you should head to the Bay Area. San Francisco leads the country in projected value per square foot (as well as leading the country is actual cost per square foot), with Berkeley and Oakland following closely behind.
1. Charleston, South Carolina
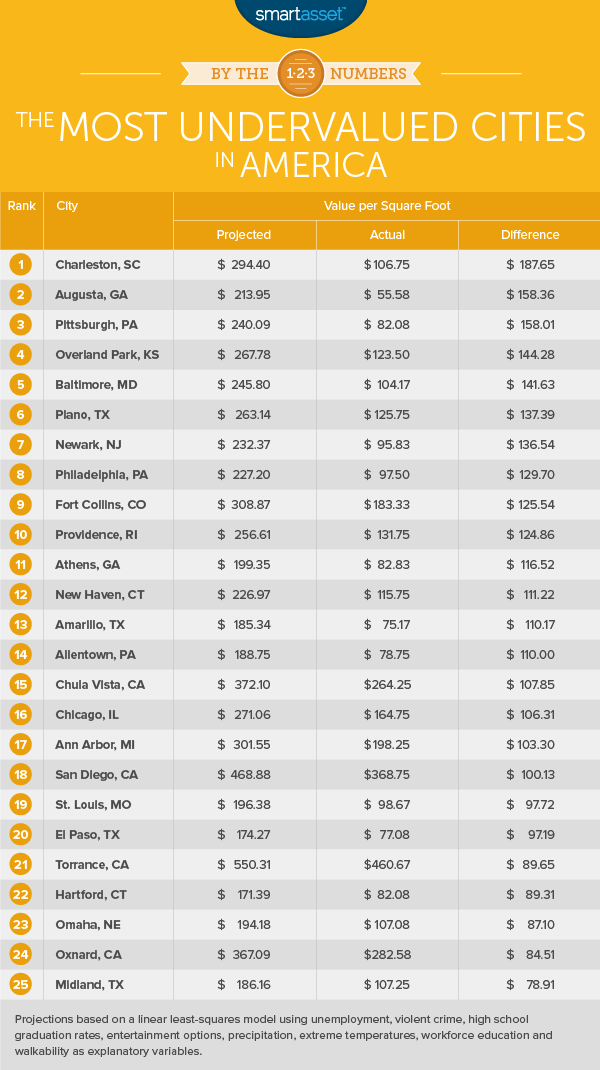
According to our model Charleston is the most undervalued city in America, up from seventh last year. We estimate, given the quality of life available in Holy City, that home prices in the area should be around $294.40 per square foot. According to data from Zillow, homes can actually be bought for $106.75 per square foot, for a savings of $187.65 per square foot.
Plus, Charleston is well known for its culinary tradition. Our data suggests that just in terms of quantity, Charleston is one of the best cities in the country for eaters. Charleston has 194 dining and entertainments per 100,000 people, 17th-most in the study.
2. Augusta, Georgia
According to Zillow data, homes in Augusta, Georgia cost about $55.58 per square foot. Our models suggests that buying a home in Augusta at that price offers great value. Prices in Augusta should be more like $213.95, based on quality of life factors. That’s almost four times higher.
The reason our model loves Augusta so much is that the city is one of the most walkable cities in the South, making it a great option for people looking for a warmer city that’s also explorable by foot. But Augusta may be too hot for some. The city usually sees around 84 days per year of extreme temperature days (days where the max temperature is less than 40 degrees or more than 90 degrees). In Augusta, the majority of those days are above 90 degrees.
3. Pittsburgh, Pennsylvania
Last year’s pick for the most undervalued city in the country, takes bronze in this year’s study. The good news for Pittsburgh residents is that thanks to high scores in entertainment and dining establishment per 100,000 residents, number of days with precipitation and walk score, our model projects that Pittsburgh offers $15 more value per square foot than last year.
Pittsburgh improved on a few scores from last year. The violent crime rate is down and Pittsburgh residents are more educated than they were a year ago. Two things which improve the quality of life in Pittsburgh. And people seem to be catching on to the value the city offers. Home value per square foot rose just almost 10% from 2015 to 2016.
4. Overland Park, Kansas
Located in northeastern Kansas, Overland Park is a safe, well-educated city which offers residents a great bargain. Our model projects that Overland Park is undervalued by about $144.28 per square foot. Overland Park compares favorably with its northern neighbor Kansas City, Kansas. Despite being just 22 minutes away by car, our model projects that Kansas City is overvalued by $54 per square foot.
5. Baltimore, Maryland
From 2015 to 2016, according to Zillow data, home values in Baltimore rose by over 10%. But the city still offers residents a great bargain. In 2016 the median home value per square foot in Baltimore was around $104. Our model estimates that figure should be more like $245, judging by quality of life metrics.
Baltimore has plenty to offer prospective residents including great walkability and mild year-round weather. One concern, if you do plan on moving here, is the relatively high unemployment rate.
6. Plano, Texas
Plano finds itself as one of the most undervalued cities in the country once again. Based on quality of life metrics, our model projects that houses for less than $263 per square foot are probably good deals. However Zillow data shows that homes are currently valued at only $125 per square foot. This leaves $137 in surplus value.
There is plenty to love about Plano. The high schools are good, 95% of high school students graduate, for example, and there are plenty of economic opportunities in the city. Plano also has the third-lowest unemployment rate in the top 10.
7. Newark, New Jersey
Newark can be a good place to live. It’s close to New York, meaning you can get the big city jobs, but you don’t pay big city prices. And our model shows that there is more to appreciate in Newark than just its distance to the Big Apple. Zillow data puts home values at about $95 per square foot. Our model suggests that based on quality of life metrics, Newark homes should be worth around $232 per square foot.
8. Philadelphia, Pennsylvania
Philadelphia, despite being a large city, leans on the affordable side. But even though it’s relatively affordable, Philadelphia does not come up short on livability. The city contains 91 dining and entertainment establishments per 100,000 residents. Most of the fun is also within walking distance. Philadelphia is the sixth-most walkable city in the study. Overall we found a difference of $129 between the actual median value per square foot and our projected median value per square foot.
9. Fort Collins, Colorado
Fort Collins is one of two newcomers to our top 10 (Augusta, Georgia is the other). This city comes with the third-lowest unemployment rate in the study, the 17th-most educated population and the 30th-lowest violent crime rate in the country.
Our model estimates that home values should be around $308 per square foot. At current prices, homes in Fort Collins are around $183 per square foot. This makes Fort Collins the most livable city in the top 10 (but also the most expensive).
10. Providence, Rhode Island
Providence, Rhode Island rounds out our list. Zillow data shows that in 2016, Providence homes had a value per square foot of $131.75. That figure is almost less than half of what our model estimates it should be. One factor makes Providence great is that it’s a relatively dry city. There are only 36 days per year with more than 0.1 inches of precipitation. This pairs well with how walkable the city is.
Data and Methodology
In order to find the most undervalued cities in America, we created a model to project home values based exclusively on quality of life metrics. In order to do this we collected data on nine metrics for 200 of the largest cities in the country. Specifically we collected data on the following metrics:
- Home value per square foot. Data is from Zillow and is for 2016.
- Violent crime rate per 100,000 residents. Data comes from the FBI’s Uniform Crime Reporting tool, as well as local government websites.
- High school graduation rate. Data comes from the U.S. Department of Education EdFacts and is for the 2014-2015 school year.
- Number of extreme temperature days. This is the average number of days per year where the maximum daily temperature is either below 40 degrees or above 90. Data is a 30-year average from 1981-2000. Data comes from the National Oceanic and Atmospheric Administration.
- Average number of precipitation days per year. This is the average number of days per year with at least 0.1 inches of precipitation.
- Walkability. This is a measure of how walkable a city is. Data comes from walkscore.com
- Percent of population with a bachelor’s degree or higher. Data comes from the U.S. Census Bureau’s 1-Year American Community Survey.
- Unemployment rate. Data comes from the Bureau of Labor Statistics local area unemployment statistics. It is the average of the unemployment rates for December 2016, January 2017 and February 2017.
- Entertainment and dining establishments per 100,000 residents. Data comes from the Census Bureau’s 2015 County Business Pattern Survey.
To model home value per square foot, we ran a linear least squares regression with home value per square foot as the dependent variable using the eight quality of life metrics as explanatory variables. Below is the resulting model. It is measured in dollars per square foot.
Home value per square foot = -6.42 – (0.04 * violent crime rate) + (2.35 * average high school graduation rate) + (0.12 * dining and entertainment establishments per 100,000 residents) – (2.34 * average number of days of significant precipitation per year) – (1.37 * number of days with extreme high or low temperatures per year) + (2.64 * percentage of the population with a bachelor’s degree or higher) + (4.90 * walk score) – (11.57 * unemployment rate).
While that formula may look complicated at first it is actually easy to read. For example, we see that in our formula violent crime rate is multiplied by -0.04 (also known as the coefficient). This means that if the violent crime rate goes up by 1, assuming all other metrics remain constant, the projected home value per square foot will go down by $0.04.
The R-squared for the model is 0.683 which means it accounts for 68.3% of the variation. We can see how overvalued or undervalued a city is by plugging our data back into our formula. By plugging the data we collected back into our model we get a projection for home value per square foot which we can compare to the Zillow data. We used the difference between the projected value, according to our formula and quality of life data, and current Zillow value to determine how overvalued or undervalued a city is.
We did not include certain metrics like new home construction or population change in our model because we were just looking to measure quality of life. Because of this, these figures are not meant as a prediction.
The data analysis for this study was completed by Nick Wallace.
Questions about our study? Contact us at press@smartasset.com.
Photo credit: ©iStock.com/SeanPavonePhoto