 Written by
It is common occurrence on American highways for near-accidents to occur. It is also a common occurrence on American highways for people in near-accidents, to look at the license plate of the near-accident-causer and think to themselves, “Oh, well of course they’re from Massachusetts.” Or some other state. It seems like almost every state has a reputation for having terrible drivers. Thanks to data from the National Highway Traffic Safety Administration we can confirm some of those myths and dispel others.
Looking to move? Check out mortgage rates in your new area here.
According to the National Highway Traffic Safety Administration around 32,000 people were killed in vehicle-related incidents in 2014. Of course some incidents are genuinely accidents, while some are clearly the fault of one driver, like in the event of drunk driving. But deaths and DUIs are not the only metrics to measure bad driving, people who receive speeding tickets or do not have automobile insurance can also be considered negligent drivers.
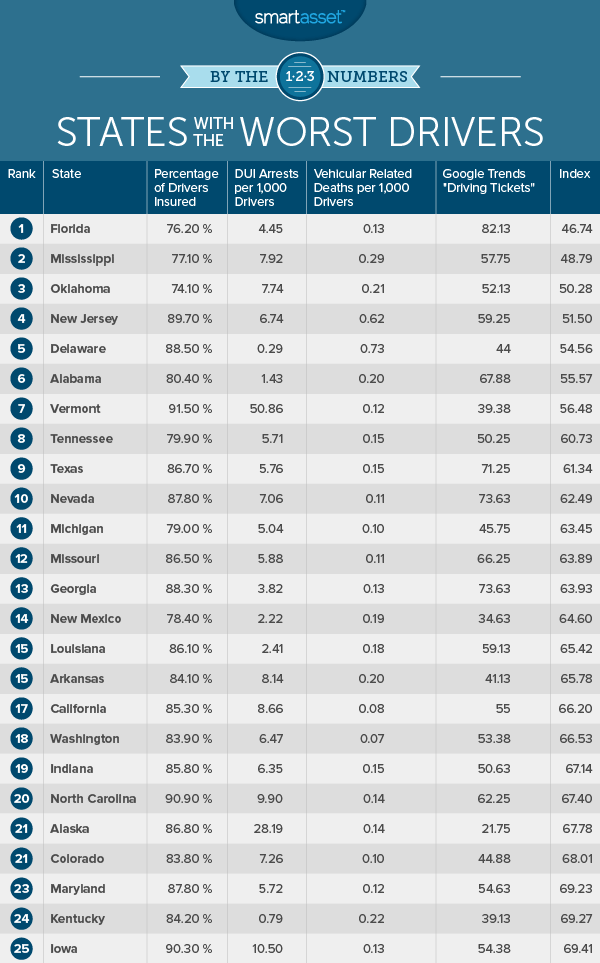
To find the states with the worst drivers SmartAsset looked at number of drivers, DUI arrests, people killed, google trends in speeding tickets and percentage of people who have auto insurance. To find out how we put all these numbers together to create our index please read the full methodology below.
Key Findings
No Massachusetts. Boston drivers usually have a reputation as bad drivers but the numbers we analyzed don’t bear that out. Massachusetts ranks 48 on our list. While we have no data on non-fatal accidents, the fact that they lead the nation in insured rate is a positive sign.
Be careful when driving in the southeast. Maybe it’s the heat causing road rage, but four out of the top ten states in our study are located in the southeast.
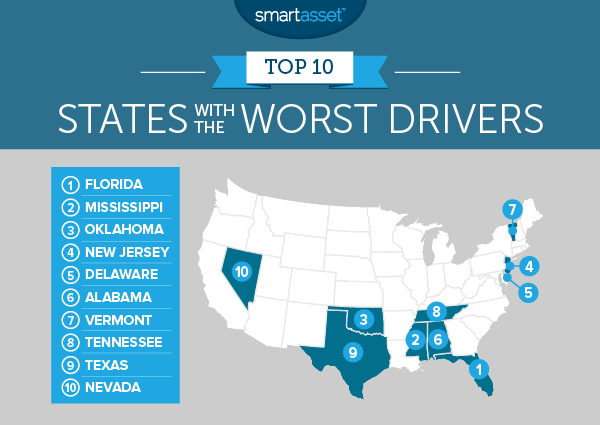
1. Florida
Florida is often plagued with a reputation for bad drivers. The numbers seem to show that this might, in fact, be true. Floridians google “speeding tickets” and “traffic tickets” more than any other state. They also have the second lowest number of insured drivers in the nation.
2. Mississippi
Another southern state and another state in which one ought to be extra careful when driving through. Mississippi had the 5th highest deaths resulting from vehicular incidents. One area where Mississippi can improve is in DUIs. Mississippi had the 12th highest rate of DUI arrests per driver in the country. Like Florida relatively few people are insured. They rank 3rd worst in that category with only 77% insured.
3. Oklahoma
Continuing on the theme of states with low insured driver rates, Oklahoma has the least. Only 74% of drivers in Oklahoma are insured. It does not get much better for the state in the other categories we looked at. They have one of the 15 worst scores in DUIs per thousand drivers (7.74), number of people killed per thousand drivers in vehicular incidents (.21) and rate of googling parking and traffic tickets (52.13).
4. New Jersey
The Garden State has the infamy of being the state with the second most deaths per driver at 0.62. New Jersey drivers are more likely to be insured than some of the other states on our list. New Jersey drivers are insured at a rate of almost 90%, coming in 22nd on our list.
5. Delaware
New Jerseys neighbor and rival for worst drivers in the northeast, Delaware is unfortunately the only state with more deaths per driver than New Jersey. One curious statistic is that while Delaware has the lowest DUI rate per driver, 40% of deaths occurred when the driver was above the legal limit for drinking, which is the 4th highest rate in the country.
6. Alabama
Another southern state and a similar story to the others with pretty bad scores all around. One bright spot – Alabama has the 4th best score with only 1.42 DUI arrests per thousand drivers. Like Delaware, though, that statistic does not tell the whole story, 33% of deaths in Alabama resulted from a driver being over the legal alcohol limit.
7. Vermont
Vermont leads the nation in DUIs per driver with 50 per thousand drivers. However, they also have the lowest percentage of deaths resulting from drunk driving, at 20%.
8. Tennessee
Tennessee is one of the least insured states in the country, with 20% of people not having car insurance. Tennessee also has the 18th highest number of deaths per thousand drivers. One positive is that they are in the better half of the country for DUI per thousand drivers at 5.7.
9. Texas
Tragically for Texas it has the highest percentage of deaths coming from drunk drivers at 40% and yet it is in the better half of states for DUI arrests. Recent news that Uber and Lyft will both be leaving Austin may have an impact. According to MyStatesman, Austin only has permits for 756 legal taxis and is hoping to increase that to 1,161. But for a tech hot-spot with a population of 850,000 even this may not be enough.
10. Nevada
Nevada is the 3rd worst state for traffic and speeding tickets (when comparing googling trends) as well as being the 17th worst state for DUIs. The good news is that 88% of Nevada drivers are insured.
Data and Methodology
In order to find out which state had the worst drivers SmartAsset collected data across 4 metrics.
Percentage insured. Data is taken from the Insurance Research Council.
DUI per thousand drivers. Number of drivers is taken from the Federal Highway Administration. Number of DUIs is taken from the State Justice Department.
Deaths per thousand drivers. Data is taken from the Fatality Analysis Reporting System, which is part of the National Highway Traffic Safety Administration.
Google trends on driving tickets. This data is the average of the scores each state got in google trends for the 8 phrases: speeding ticket, “speeding ticket,” speeding tickets, “speeding tickets,” traffic ticket, “traffic ticket,” traffic tickets and “traffic tickets.”
We then indexed each factor for every state giving equal weighting and then finding the average score per state to create the final index.
Questions about our study? Contact us at blog@smartasset.com.
Photo credit: ©iStock.com/Ben Harding