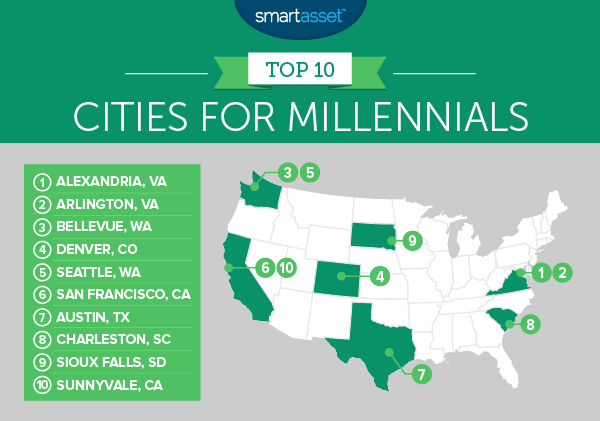
Millennials are now the largest generation in the country, having passed Baby Boomers sometime in the past year. There are no shortage of stereotypes used to describe millennials (defined as those ages 18-34 in 2015). Millennials have been called lazy, entitled and narcissistic. But in reality, many millennials don’t have it easy. The generation faces an incredibly competitive globalized labor market and are often saddled with mortgage-sized student loan payments, tacked onto sky-high rent costs. This means that it’s important for millennials to be smart about where they choose to live. With that in mind, we ranked the best cities for millennials.
Find out: Should you rent or buy?
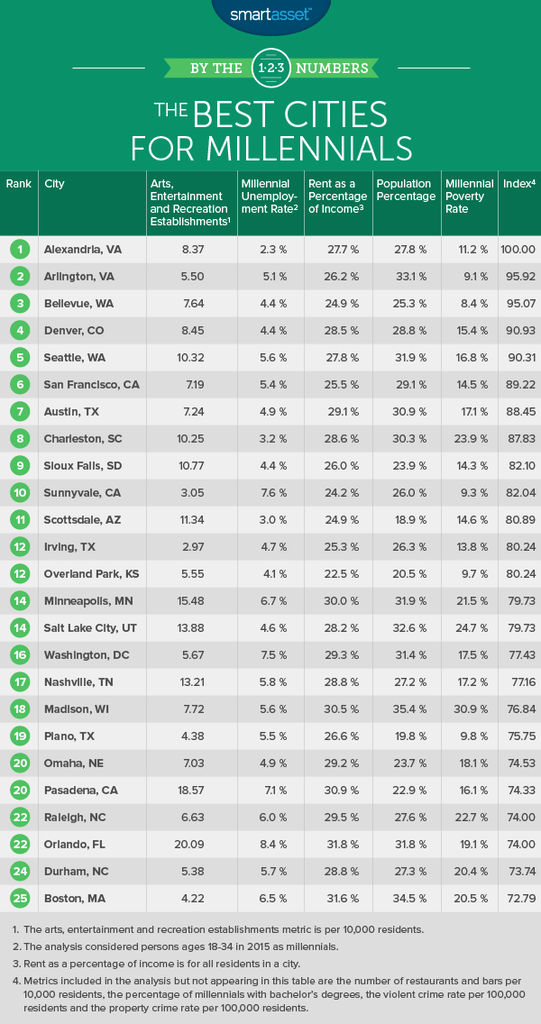
In order to determine the best cities for millennials, we looked at several different factors including the poverty and unemployment rates among millennials. We also considered the number of arts, entertainment and recreation establishments per 10,000 residents, the number of bars and restaurants per 10,000 residents, the violent and property crime rates and the percentage of the population which falls into the millennial generation. For a full breakdown of what data we used and where we got it, read the Data and Methodology section below.
Key Findings
- Virginia is for millennials – Two Virginia cities, Alexandria and Arlington, rank first and second in our study. They are both satellite cities of Washington, D.C. The nation’s capital itself ranks a respectable 16th.
- Double winners – Virginia isn’t the only state that appears twice in our top 10. Washington and California also snagged two coveted spots each.
- Wide success gap – Millennials are doing pretty well in the cities that comprise our top 10. The poverty rate for millennials in these cities average only 14%, with a low of 8% in Bellevue, Washington. At the bottom of the rankings, however, we see cities like Detroit and Jackson, Mississippi where the poverty rates for millennials are 39% and 36%, respectively.

1. Alexandria, Virginia
Alexandria tops our list as the best city for millennials. Millennials will want to take note of the city’s unemployment rate – only 2.27% of millennials in Alexandria are unemployed. Other economic indicators are solid as well. Renters pay 27% of their income on rent on average (meaning they are not considered housing cost-burdened) and the poverty rate for millennials is only 11%. Both of those measures rank in the top 25 respectively. Alexandria also has the second-lowest property crime rate in our top 10 and the third-lowest violent crime rate. Currently, almost 28% of Alexandria’s population are millennials, but don’t be surprised if that number rises.
2. Arlington, Virginia
We highlighted Arlington in the past as the hardest-working city in America, and that work ethic is not lost on millennials. Millennials in Arlington are the most educated, have the eighth-lowest poverty rate and the 18th-lowest unemployment rate. In fact, for millennials looking solely at economic indicators, Arlington may be the place to be. Unfortunately, Arlington didn’t score as well in the fun indicators. According to Census data, there are only about 31 restaurants and bars per 10,000 residents and about five arts, entertainment and recreation establishments per 10,000 residents. For both metrics Arlington ranks in the 70s.
3. Bellevue, Washington
Bellevue is a satellite city of Seattle. And in many ways, the Bellevue-Seattle relationship mirrors the Arlington-Washington, D.C. relationship. One is a bigger, more expensive city with more things to do and the other is a not-as-fun-city with better economic indicators. According to Census data, Bellevue has a millennial unemployment rate of just 4.5%. Plus, Bellevue renters only pay 25% of their income on rent on average and only 8.4% of millennials in Bellevue live under the poverty line. The city ranks in the top 10 in all of these metrics.
4. Denver, Colorado
Denver has the unique quality of being a large city that’s still a great option for outdoor enthusiasts. For millennials that may be an enticing combination. Apart from the quick access to outdoor activities, Denver has a good number of other attractions on offer. There are eight arts, entertainment and recreation establishments per 10,000 residents and 48 restaurants and bars per 10,000 residents. Both metrics rank in the top 30. The Mile High City also has the eighth-lowest unemployment rate for millennials at 4.4%.
Related Article: What Is the True Cost of Living in Denver?
5. Seattle, Washington
Coming in two spots behind Bellevue is Seattle, its neighbor across Lake Washington. The birthplace of grunge and a mecca for coffee enthusiasts, Seattle is also a great spot for millennials. It combines fun with good job prospects. Seattle ranks 20th for arts, entertainment and recreation establishments per 10,000 residents, and 21st for restaurants and bars per 10,000 residents. Seattle also has a low millennial unemployment rate of 5.5%. But the Emerald City took a hit on its crime rates. It has the second-highest property crime rate in our top 10 and the third-highest violent crime rate.
6. San Francisco, California
As you may expect of any city entrenched in the tech boom, San Francisco has a very well-educated population. Census data shows that 44% of millennials in San Francisco have a bachelor’s degree. There’s also no shortage of fun things to do in SF. There are about seven arts, entertainment and recreation establishment per 10,000 residents and 53 bars and restaurants per 10,000 residents. Unfortunately, the poverty rate in the City by the Bay could be lower. According to Census data, 14.5% of millennials have incomes which put them under the poverty line.
Related Article: Big Cities Where Incomes Are Rising Faster Than Rents
7. Austin, Texas
The Texas capital ranks seventh in our list of the best cities for millennials. Austin ranks in the top 20 for the percentage of millennials with bachelor’s degrees (29%) and the millennial unemployment rate (4.8%). Almost 31% of ATX’s current population are millennials. However, the city’s renters sit on the cusp of being considered housing cost-burdened as they spent 29% of their income on rent on average.
8. Charleston, South Carolina
Charleston comes in a close eighth, only 0.8 points behind Austin. The Palmetto City is great for millennials in many ways. Millennial unemployment is low – only 3.1% of millennials who want a job can’t get one. And millennials in Charleston are also well-educated, 36% of them have bachelor’s degrees. There are also 10 arts, entertainment and recreation establishments per 10,000 residents, and a whopping 56 bars and restaurants per 10,000 residents – the highest ratio in our top 10. However, millennials thinking about calling Charleston home will want to be aware that almost a quarter of millennials there are considered below the poverty line.
9. Sioux Falls, South Dakota
Sioux Falls, South Dakota’s capital, takes ninth place on our list. Sioux Falls has relatively solid economic indicators for millennials. The unemployment rate for millennials in Sioux Falls is the sixth-lowest at 4.4%, while the poverty rate is 14%. And renters in the city spend a respectable 26% of their income on rent on average. Plus, this may come as a surprise to some, but Sioux Falls has the best “fun score” in our top 10 with 10.7 arts, entertainment and recreation establishments per 10,000 residents.
Check out our budget calculator.
10. Sunnyvale, California
Named the safest city in America in 2016, Sunnyvale rounds out our best cities for millennials. The Bay Area city scores in the top 10 for its millennial poverty rate and the median percent of income going to rent. It also has the 11th-highest rate of millennials with bachelor’s degrees. Where Sunnyvale falls short is in an abundance of things to do. It ranks 139th for arts, entertainment and recreation establishments per 10,000 residents and 107th for restaurants and bars per 10,000 residents.

Data and Methodology
In order to rank the best cities for millennials we looked at the following nine factors:
- Arts, entertainment and recreation establishments per 10,000 residents. This covers a wide range of establishments, including theater companies, golf courses, bowling alleys, museums and historical centers. Data comes from the U.S. Census Bureau’s 2014 Business Patterns Survey.
- Restaurants and bars per 10,000 residents. Data comes from the U.S. Census Bureau’s 2014 Business Patterns Survey.
- Millennial unemployment rate. This is the percentage of millennials in a city who are looking for work but are not currently employed. Data comes from the U.S. Census Bureau’s 2015 American Community Survey.
- Rent as a percentage of income. This is the median percentage of income spent on housing costs by all renters in each city. The Census Bureau defines people who pay 30% or more of their income on rent as housing cost-burdened. Data comes from the U.S. Census Bureau’s 2015 American Community Survey.
- Millennials as a percent of the population. This is the percentage of a city’s population who are millennials. Data comes from the U.S. Census Bureau’s 2015 American Community Survey.
- Millennial poverty rate. This is the percentage of the millennial population in each city who are considered below the poverty line. Data comes from the U.S. Census Bureau’s 2015 American Community Survey. The Census considers individuals making less than $12,082 as living in poverty.
- Percentage of millennials with bachelor’s degrees. This is the percentage of millennials in each city who hold bachelor’s degrees. Data comes from the U.S. Census Bureau’s 2015 American Community Survey.
- Property crime rate. This is measured at the number of property crimes per 100,000 residents. Data comes from the 2015 FBI Uniform Crime Reporting Program and from local police departments and city websites.
- Violent crime rate. This is measured as the number of violent crimes per 100,000 residents. Data comes from the 2015 FBI Uniform Crime Reporting Program and from local police departments and city websites.
For this study we considered the millennial generation as made up of persons aged 18-34 in 2015.
We ranked each city according to these nine metrics. We then averaged those rankings giving double weight to the millennial unemployment rate, millenials as a percentage of the population and the millennial poverty rate. We gave a half weight to violent and property crime rates. All other factors were given a weighting of one. The final score was based on those rankings. The city with the best overall ranking was given a score of 100 and the city with the lowest overall ranking was given a score of 0.
Questions about our study? Contact us at press@smartasset.com.
Photo credit: ©iStock.com/filadendron
