 Written by
A central question for most Americans when choosing where to live is whether to rent or buy. Each comes with its pros and cons. Renting a place can offer more flexibility without the burden of mortgage payments, but means you are spending money each month without building any equity. Buying means you can build equity and have the pride of owning your home, but it can be risky if the market takes a tumble and your mortgage ends up underwater. With all of this in mind, SmartAsset decided to find the cities in America which most favor renters and those which most favor buyers.
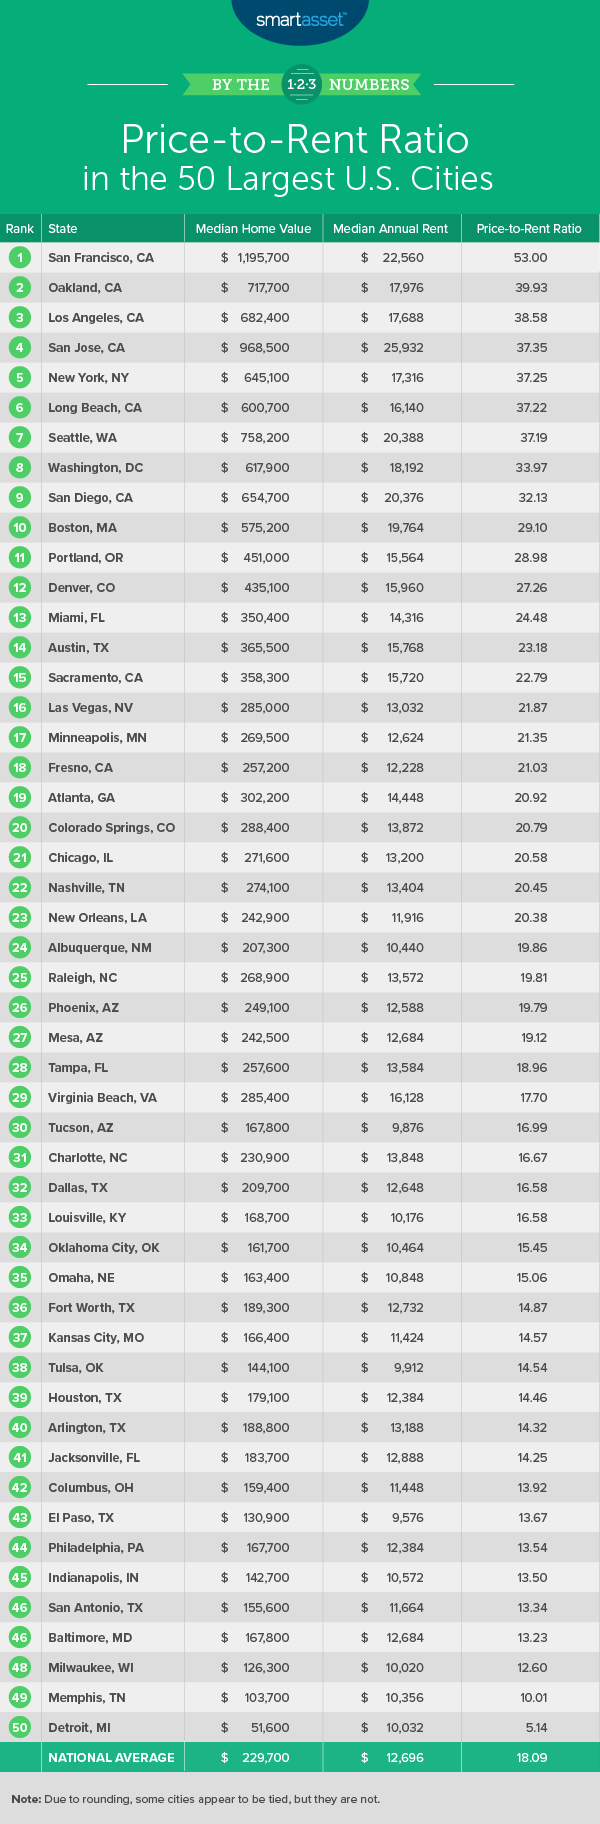
We did this by calculating the price-to-rent ratio of the 50 largest cities in America. The price-to-rent ratio is the ratio of the median home value to the median annual rent. As a general rule, a lower price-to-rent ratio means conditions are more favorable for buying a home. By contrast, a higher price-to-rent ratio means conditions are better for renting. According to Trulia’s Rent vs. Buy Index, the specific thresholds are as follows: a price-to-rent ratio of 1 to 15 indicates that buying is more favorable, a ratio of 16 to 20 indicates that renting is typically more favorable and a ratio of 21 or more indicates that renting is more favorable. For details on our data sources and how we put all the information together to create our final rankings, check out the Data and Methodology section below.
The coronavirus pandemic is negatively affecting many Americans’ livelihoods and finances. In response to the resulting economic crisis, the government recently passed a stimulus package called the Coronavirus Aid, Relief and Economic Security (CARES) Act that included several provisions directly and indirectly protecting homeowners and renters.
Key Findings
- Renter’s market. Overall, the national housing market is favorable for renting. The national price-to-rent ratio is 18.09, and Trulia notes that a price-to-rent ratio between 16 and 20 indicates it makes more economic sense to rent than buy.
- California’s big cities are friendlier toward renters than homebuyers. Four of the five cities with the highest price-to-rent ratios in our study are among the 15 largest cities in the U.S. – and all in California. They are San Francisco, Oakland, Los Angeles and San Jose. The average home value in these four cities exceeds $891,000. If you have your sights set on living in one of these metropolises, renting may make sense. Rent prices are still expensive in these cities, though. In 2018, the median annual rent across these four cities was more than $21,000, on average, compared to $12,696 nationwide.
Cities With the Highest Price-to-Rent Ratios: Where Renting Is More Favorable Than Buying
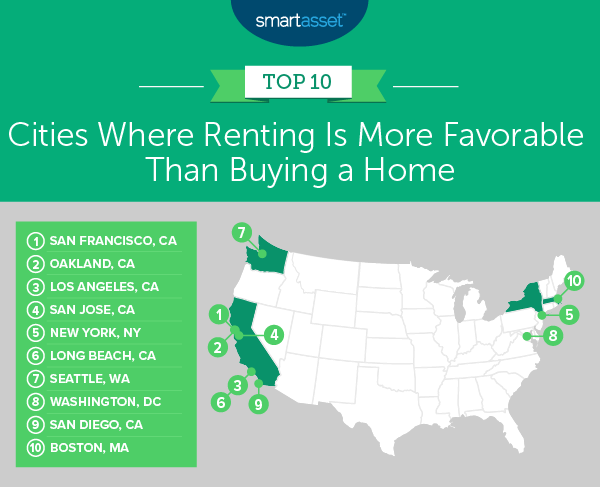
1. San Francisco, CA
San Francisco, California leads this list as the friendliest city in the U.S. for renters compared to homebuyers. The 2018 median home value in San Francisco was $1,195,700, and the median annual rent was $22,560. That results in a price-to-rent ratio of 53.00.
2. Oakland, CA
Oakland, California, just across the bay from San Francisco, has the second-highest price-to-rent ratio of the 50 largest cities in the country. The 2018 median home value was $717,700. The median yearly rent for the same year was $17,976, resulting in a price-to-rent ratio of 39.93.
3. Los Angeles, CA
Located in Southern California, Los Angeles had a 2018 median home value of $682,400 and a median yearly rent of $17,688, resulting in an environment that is favorable to renters over homebuyers. The price-to-rent ratio there is 38.58.
4. San Jose, CA
San Jose, California has the fourth-highest price-to-rent ratio across the 50 largest cities in the country. The 2018 median home value there was $968,500, and the median yearly rent was $25,932. That makes for a price-to-rent ratio of 37.35.
5. New York, NY
New York, New York is the only city in our top five that isn’t located in California. In 2018, the median home value in the city was $645,100, and the median rent was $17,316. That comes to a price-to-rent ratio of 37.25.
Cities With the Lowest Price-to-Rent Ratios: Where Buying Is More Favorable Than Renting
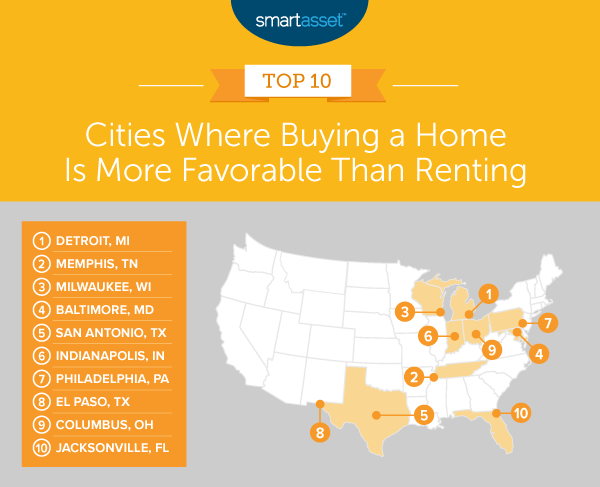
1. Detroit, MI
Detroit, Michigan has the lowest price-to-rent ratio across the 50 largest cities in the country, meaning it is more favorable to homebuyers than renters. The 2018 median home value was $51,600, and the 2018 median annual rent was $10,032, resulting in a price-to-rent ratio of 5.14.
2. Memphis, TN
Memphis, Tennessee had a 2018 median home value of $103,700. The median annual rent in the city in 2018 was $10,356. With a price-to-rent ratio of 10.01, the city is relatively homebuyer-friendly.
3. Milwaukee, WI
For those seeking homeownership in the Midwest, Milwaukee, Wisconsin is another city that is more favorable to homebuyers than renters. Milwaukee had a 2018 median home value of $126,300 and a median yearly rent of $10,020. This results in a price-to-rent ratio of 12.60.
4. Baltimore, MD
The only city in our bottom five on the East Coast, Baltimore, Maryland has the fourth-price-to-rent ratio across all 50 cities in our study. The 2018 median home value there was $167,800. With a 2018 median annual rent of $12,684, Baltimore’s price-to-rent ratio is 13.23.
5. San Antonio, TX
In 2018, the median home value in San Antonio, Texas was $155,600 and the median annual rent was $11,664. This results in a price-to-rent ratio of 13.34, making San Antonio the fifth-friendliest city for homebuyers across all 50 cities in our study.
Data and Methodology
To find the cities in America with the highest and lowest price-to-rent ratios, we looked at the median home values and median rent for the 50 largest cities in America. We divided the median home value for each city by the median annual rent for the city to calculate the price-to-rent ratio and ranked the cities according to this figure. The city with the highest price-to-rent ratio was the most favorable for renters, and the city with the lowest price-to-rent ratio was the most favorable for homebuyers.
All data comes from the Census Bureau’s 1-year American Community Survey for 2018.
We used Trulia’s Rent vs. Buy Index as guide for specific price-to-rent ratio thresholds: a price-to-rent ratio of 1 to 15 indicates that buying is more favorable, a ratio of 16 to 20 indicates that renting is typically more favorable and a ratio of 21 or more indicates that renting is more favorable.
Tips for Managing Housing Expenses
- Professional advice. A financial advisor can help you see the impact of your housing choices. Finding the right financial advisor that fits your needs doesn’t have to be hard. SmartAsset’s free tool matches you with financial advisors in your area in 5 minutes. If you’re ready to be matched with local advisors that will help you achieve your financial goals, get started now.
- To buy, or not to buy? Still figuring out whether to rent or buy? SmartAsset’s calculator can help you make the choice.
- Prudent budgeting with a little help. A budget can help put housing expenses in context with your other bills. Use SmartAsset’s budget calculator to get started.
Questions about our study? Contact press@smartasset.com
Photo credit: ©iStock.com/Indysystem