 Written by
While affording a down payment may be the largest challenge to buying a home, many other factors play into finding the right place to take out a mortgage and put down roots. Inventory and pricing vary widely by city and affect buyers’ options and ability to negotiate. The coronavirus pandemic has certainly complicated many people’s home buying prospects as they face greater unemployment and investment losses. Though mortgage rates initially ticked upward in March as the crisis intensified in the U.S., mortgage rates typically fall when an economy slows. As such, prospective buyers should have patience and do their research.
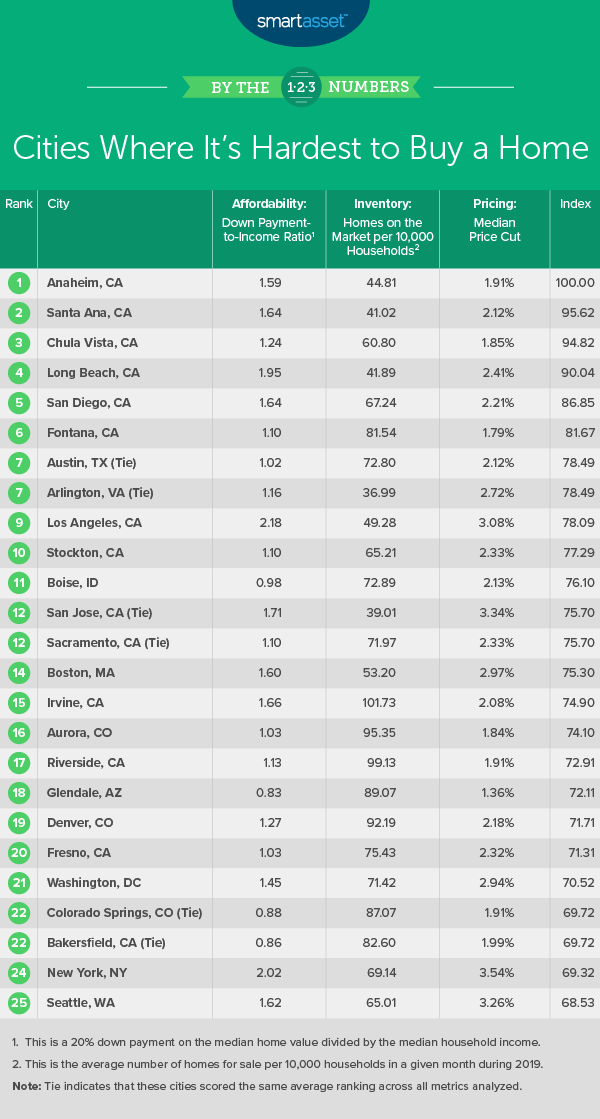
In this study, we uncovered the cities where it is hardest to buy a home, accounting for affordability, inventory and pricing in each place. Specifically, we analyzed the down payment-to-income ratio, the number of homes on the market compared to number of households and the average price cut for homes that sold recently. For details on our data sources and how we put all the information together to create our final rankings, check out the Data and Methodology section below.
Key Findings
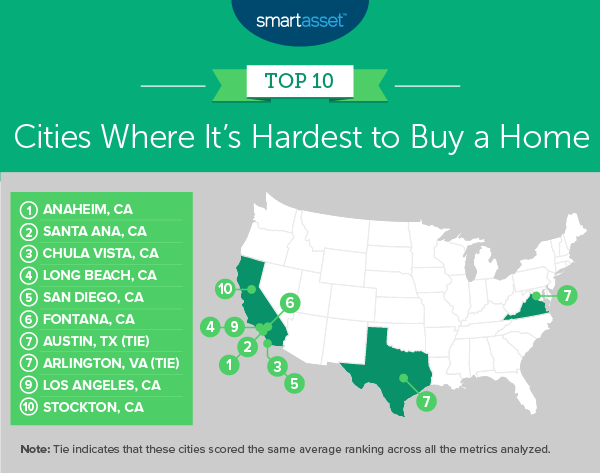
- Homebuyers may struggle in Southern California. Of the top 10 U.S. cities where it is hardest to buy a home, eight are located in California, seven of which are in the southern part of the state. The seven Southern California cities include Anaheim, Santa Ana, Chula Vista, Long Beach, San Diego, Fontana and Los Angeles. On average across those seven cities, a 20% down payment on the median-valued home is worth 1.62 times the median household income, and houses for sale had price cuts of only 2.19%.
- There’s a wide range of affordability and inventory across cities. The down payment-to-income ratio across the 100 cities ranges from 0.33 in Detroit, Michigan to 2.18 in Los Angeles, California. Similarly, at the low end of available housing inventory, Buffalo, New York has fewer than 32 homes for sale in a month for every 10,000 households in the area while Las Vegas, Nevada has more than 400.
1. Anaheim, CA
Located just outside of Los Angeles, Anaheim, California has a very competitive real estate market. It ranks in the bottom 15 for all three metrics: affordability, inventory and pricing. It has the 12th-highest down payment-to-income ratio (1.59), the sixth-lowest average number of homes for sale in a month for every 10,000 households (44.81) and the 14th-lowest average price cut for home sales (1.91%).
2. Santa Ana, CA
Santa Ana, California ranks as the second city in the U.S. where it is hardest to buy a home. Though homebuyers seem to have more negotiating power in Santa Ana than in Anaheim, Santa Ana is generally less affordable. In 2018, a 20% down payment on the median home value ($534,600) was 1.64 times the median household income ($65,313). This down payment-to-income ratio is the ninth-highest in our study.
3. Chula Vista, CA
Of homes that were sold in Chula Vista, California during 2019, the median price cut from the seller’s asking price was only 1.85%, the 12th-lowest in our study. Chula Vista additionally had the 14th-lowest inventory of the 100 cities we considered, meaning fewer options for buyers to consider.
4. Long Beach, CA
Though Long Beach, California ranks toward the middle of all 100 cities in our study in terms of pricing and buyers’ abilities to negotiate, it has the fifth-lowest inventory and fourth-worst affordability ranking. Fewer than 42 homes for every 10,000 households were available for buyers during 2019. Moreover, a 20% down payment on the median-valued home was almost twice as much as the median household income for residents in the area.
5. San Diego, CA
Similar to Long Beach, San Diego, California does not perform particularly well on our affordability metric. In 2018, a 20% down payment on the median home value in the area was 1.64 times the median household income. San Diego also falls short on inventory relative to 81 other cities in our study. Zillow data shows there were fewer than 3,500 homes on the market in any given month during 2019, meaning that for every 10,000 households, only about 67 homes were for sale.
6. Fontana, CA
Fontana, California is farther away from downtown Los Angeles than the cities of Anaheim, Santa Ana and Long Beach. With that distance, housing inventory is nearly doubled. Based on data from Zillow and the Census Bureau, there are almost 82 homes available for every 10,000 households in Fontana. Homebuyers pay relatively close to the asking price on homes in Fontana: The median price cut on homes in 2019 was 1.79%, the ninth-lowest rate for this metric in our study.
7. Austin, TX (tie)
Austin, Texas ranks in the bottom third of the 100 cities in our study for all three metrics: pricing, inventory and affordability. Data from Zillow shows that in 2019 the median price cut for homes bought in the area was only 2.12%, the 29th-lowest rate across all cities in our study. Additionally, we estimate that, on average, there are about 73 homes on the market for every 10,000 households in the area.
7. Arlington, VA (tie)
Housing inventory relative to population is extremely low in Arlington, Virginia. Using Zillow and Census Bureau data, we found that fewer than 37 homes were for sale on average during any given month, for every 10,000 households. The average down payment on a home in Arlington also exceeds the average household income. We found that the 2018 down payment-to-income ratio was 1.16, the 21st-highest in the study.
9. Los Angeles, CA
Los Angeles, California is home to the least affordable real estate market across all 100 cities in our study. Using data from the Census Bureau, we found that the down payment-to-income ratio was 2.18 in 2018. While the median household income was roughly in line with the national average ($62,474 in Los Angeles vs. $61,937 nationwide), home values are much higher. The 2018 median home value in Los Angeles was $682,400 compared to $229,700 in the U.S. overall.
10. Stockton, CA
Though Stockton, California ranks in the middle of the 100 cities in our study in terms of price cuts, it ranks in the bottom fourth of all cities on inventory and affordability. We estimate that there are about 65 homes for sale for every 10,000 households in the area and the down payment-to-income ratio is approximately 1.10.
Data and Methodology
To find the cities where it is hardest to buy a home, SmartAsset looked at data for 100 of the largest cities in the U.S. (Of the 100 largest cities in the U.S. by population, San Francisco, California; Indianapolis, Indiana; Oakland, California; Fort Wayne, Indiana; Paradise, Nevada; Fremont, California and Richmond, Virginia were missing complete data). We compared those 100 cities across the following three metrics:
- Affordability: down payment-to-income ratio. This is a 20% down payment on the median valued home divided by the median household income. Data comes from the Census Bureau’s 2018 1-year American Community Survey.
- Inventory: average houses on the market monthly for every 10,000 households. Data on number of homes for sale comes from Zillow and is for the average in a given month during 2019. Data on the number of households in each city comes from the Census Bureau’s 2018 1-year American Community Survey.
- Pricing: median price cut. This is the median price cut on homes that were sold. Data comes from Zillow and is for 2019.
We ranked each city in every metric, giving a full weighting to all metrics. We then found each city’s average ranking and used the average to determine the final score. The city with the highest average ranking received a score of 100. The city with the lowest average ranking received a score of 0.
Home Buying Tips
- Calculate the full costs. Though a mortgage is typically the largest annual expense for homeowners, other costs like property taxes and home insurance can add up. Our comprehensive home buying guide has a property tax calculator, budget calculator and many informative articles that can help you make smart decisions regarding housing.
- Remember to negotiate. Many of the cities on the list above rank poorly because buyers are not able to negotiate prices downward. However, this is not the case for many other cities. Our list of the Cities Where it Pays Off to Negotiate on Home Price highlights some of these places where it is important to think carefully about what you send in as an initial offer. If you want more information on making an offer on a home and steps to follow, our guide can help.
- Consider a financial advisor. Buying a home is a big decision, and it may be a good idea to consult a financial advisor before going through the process. Not only can a financial advisor help in the home buying process, but this expert can also help you be in better control of your money overall. Finding the right financial advisor that fits your needs doesn’t have to be hard. SmartAsset’s free tool matches you with financial advisors in your area in 5 minutes. If you’re ready to be matched with local advisors that will help you achieve your financial goals, get started now.
Questions about our study? Contact us at press@smartasset.com
Photo credit: ©iStock.com/Ridofranz