 Written by
Selling a house can prove a challenging process if your property stays on the market longer than you’d like or sells at a loss. Having access to high-quality real estate professionals in your area can help improve your experience, but there are some cities where selling a house is just a bit easier than others.
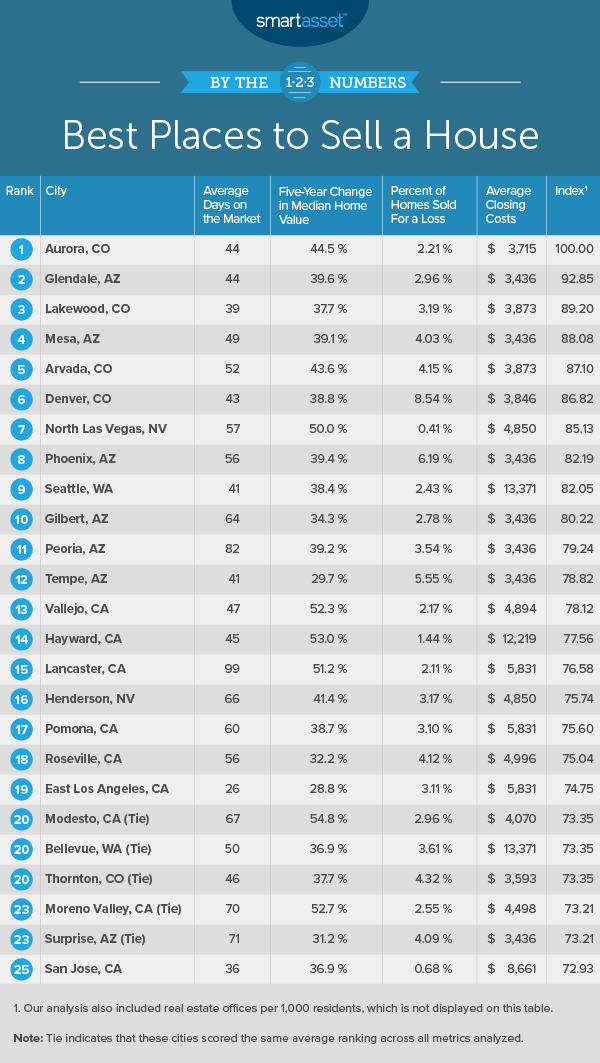
To find the best cities to sell a house, SmartAsset analyzed data for 165 of the largest cities in the U.S. across the following five metrics: five-year change in median home value, average number of days on the market, percentage of homes sold for a loss, closing costs and real estate offices per 1,000 residents. For details on our data sources and how we put all the information together to create our final rankings, check out the Data and Methodology section below.
This is SmartAsset’s fourth annual study on the best cities to sell a house. Check out the 2019 version here.
Key Findings
- Western cities are best for selling homes. Every city in the top 10 of this list is in the West, according to Census regional divisions. In fact, all but two of the top 10 cities in the study are in either Arizona or Colorado. Furthermore, the first non-Western city to enter the study is Richardson, Texas at No. 29.
- Less California love. In our 2019 study, four cities in the Golden State were in the top 10 – Hayward at No. 3, Moreno Valley tied for No. 5, Pomona at No. 9 and Elk Grove at No. 10. This year all of them fell out of the top 10 and dropped to 14th, 23rd, 17th and 33rd, respectively, still staying within the top fifth of the study.
- Wait time is more than double in the bottom 10. Across the top 10 cities in our study, the average amount of time a house stays on the market is 49 days. But across the bottom 10 cities – all in Northeastern, Midwestern and Southern states – you’ll have to wait more than twice that amount of time for your house to be sold, about 104 days.
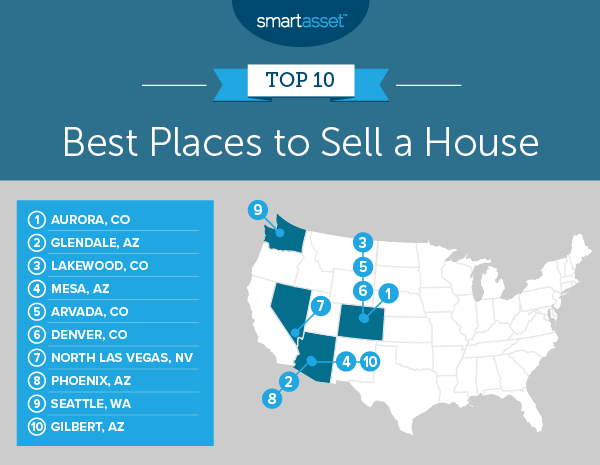
1. Aurora, CO
Aurora, Colorado leads this list. Aurora finishes eighth overall for its low percentage of homes sold for a loss, at approximately 2.2%. It comes in ninth for its high number of real estate offices per 1,000 residents, at 1.90. Aurora also ranks in the top 10% of the study, 15th overall, for five-year change in median home value, with an increase of about 44.5%.
2. Glendale, AZ
While Glendale, Arizona doesn’t finish at the top of any metric, it does crack the top 30 in three metrics – a five-year median home value bump of about 39.7%, an average time on the market of 44 days and less than 3% of homes sold for a loss.
3. Lakewood, CO
Lakewood, Colorado’s best ranking is for the average number of days a house stays on market – 39 days, the 16th-shortest time across all 165 cities in the study. Lakewood also ranks 25th overall for the percentage of homes sold for a loss, at only approximately 3.2%.
4. Mesa, AZ
Mesa, Arizona homes have increased in value by about 39.1% in the past five years, the 27th-highest increase overall. Mesa finishes within the top 35 of all 165 cities in the study for both its relatively low percentage of homes sold for a loss, at about 4%, and relatively low closing costs at the county level, at $3,436.
5. Arvada, CO
Arvada, Colorado finishes 18th out of 165 in our study for its relatively high five-year change in median home value, seeing those values go up more than 43% from 2014 through 2018. Furthermore, Arvada ranks within the top fifth of the study, 32nd-highest, for its number of real estate offices per 1,000 residents, at 1.73.
6. Denver, CO
Denver, Colorado has the second-highest number of real estate offices per 1,000 residents, at 2.53, giving those who are looking to sell their homes more access to expert professionals who can help. It ranks within the top 25 of the study for its low average number of days that a house stays on the market, at 43 days. Additionally, the Mile High City ranks at No. 28 of 165 for its relatively high five-year change in home value, a bump of almost 39%.
7. North Las Vegas, NV
North Las Vegas, Nevada is the highest-ranking city in our study that is not located in Colorado or Arizona. It ranks within the top 10 for two metrics. The city has the seventh-highest five-year change in median home value, at just more than 50%, and ranks No. 1 for the metric measuring the percentage of homes sold for a loss, at a very low 0.41%.
8. Phoenix, AZ
Phoenix, Arizona gets its highest ranking in the median home value change metric, placing 25th out of 165, with an increase of more than 39% over the five-year period from 2014 through 2018. Closing costs are approximately $3,436 and there are approximately 1.4 real estate offices per 1,000 residents there.
9. Seattle, WA
Seattle, Washington, the only city in our top 10 located outside of the Southwest, has the third-highest number of real estate offices per 1,000 residents. The Emerald City also has the 11th-lowest percentage of homes sold at a loss, at about 2.4%. Additionally, it ranks 20th overall for the relatively low average number of days a house stays on the market, at 41.
10. Gilbert, AZ
Gilbert, Arizona rounds out our top 10. It has the 18th-lowest percentage in the study of homes sold for a loss, at approximately 2.8%. It also ranks 35th out of 165 for relatively low closing costs – measured at the county level – at $3,436.
Data and Methodology
To find the best cities to sell a house, SmartAsset considered available data for 165 of the largest cities across the following metrics:
- Five-year change in median home value. This is the percentage change in median home values from 2014 through 2018. Data comes from the Census Bureau’s 2014 and 2018 5-year American Community Surveys.
- Average number of days on the market. This is the average number of days a home is on the market before it is sold. Data comes from SmartAsset’s January 2020 study on the healthiest housing markets.
- Percentage of homes sold for a loss. This is the percentage of homes sold for a price lower than the previous sale price. Data comes from SmartAsset’s January 2020 study on the healthiest housing markets.
- Closing costs. This represents average closing costs by city. Data comes from SmartAsset’s 2019 study on places with the lowest closing costs.
- Real estate offices per 1,000 residents. This is the number of real estate offices per 1,000 residents. Data comes from the Census Bureau’s 2017 County Business Patterns Survey.
To create the final scores, we ranked all of the cities in each metric. Next, we found each city’s average ranking and gave a double weight to five-year change in median home value. Using this average ranking, we created our final score. The city with the best average ranking received a score of 100 and the city with the worst average ranking received a 0.
Real Estate Tips
- Get a financial advisor. If you’re making a big money decision regarding your real estate holdings, or trying to find a house to buy, consider working with an experienced financial advisor. Finding the right financial advisor that fits your needs doesn’t have to be hard. SmartAsset’s free tool matches you with financial advisors in your area in 5 minutes. If you’re ready to be matched with local advisors that will help you achieve your financial goals, get started now.
- Get an accurate snapshot of your mortgage payments. If you’re going to take on a new mortgage after you sell your home, use SmartAsset’s mortgage calculator to see what your monthly payments might look like.
- Don’t take on too much. As you explore a new home to buy, it also pays off to use SmartAsset’s How Much House Can I Afford? calculator.
Questions about our study? Contact press@smartasset.com
Photo credit: ©iStock.com/fstop123