
The key to a financially secure retirement is the planning. Whether with the steadying hand of a financial advisor to guide you to your golden years, or strategizing on your own, planning your retirement does take time and can be difficult. Some seniors, knowing they have not saved enough to retire in their current locale, plan to move to lower cost of living areas. Some seniors on the other hand have prepared themselves to live in more expensive states and can afford the higher cost of living without slipping into poverty. However the degree to which seniors are prepared for life without work varies by state.
Below we examine all 50 states and Washington, D.C. and rank them on their retirement preparedness. We compare them across a total of seven metrics. Specifically, we look at average retirement income, percent of seniors with retirement income, homeownership rate for seniors, percent of seniors who are housing cost burdened, the poverty rate for seniors, percent of seniors using food stamps and the cost of living in every state. Check out our data and methodology below to see where we got our data and how we put it together to create our final ranking.
Key Findings
- Northeast struggles – Thanks to a high cost of living, many seniors in the Northeast of the U.S. find themselves struggling in retirement. In particular, states like New York, Rhode Island, Massachusetts, Vermont and Maine all end up in the bottom 10.
- Midwest scores well – The Midwest is the region to find retirement-ready seniors. Half of the states in the top 10 are in the Midwest, including Indiana and Michigan. Those two claimed spots in the top 5.
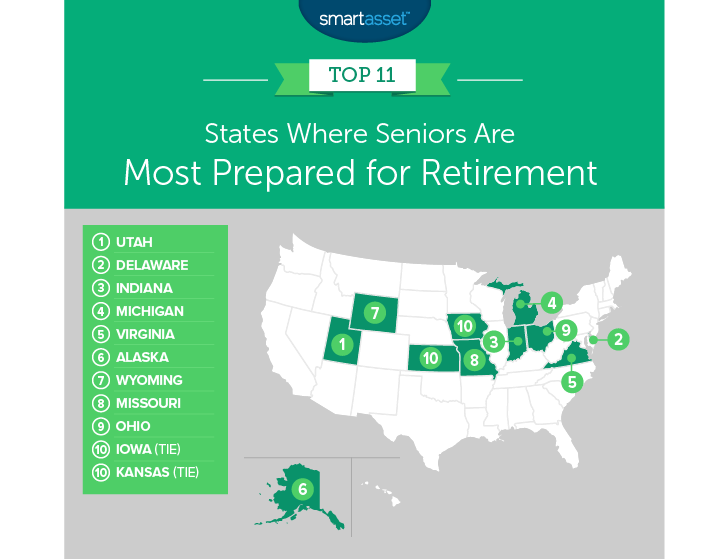
1. Utah
Seniors in no other state are as prepared for retirement as those in Utah. First of all, seniors here have secured a good amount of retirement income for themselves. Combining average retirement income with Social Security income, we estimate the average retired senior household here has about $51,105 in retirement income. Perhaps even more impressive, 86% of seniors live in a home they own. That keeps the long-term cost of housing relatively low while giving seniors the chance to sell their home if they need a little extra cash. In total, Utah ranks in the top 10 for five of our seven metrics.
2. Delaware
Delaware takes second. More than 58% of senior households here have some retirement income saved up. This state also has the fifth-highest homeownership rate for seniors. Unfortunately, that high homeownership rate has not shielded all seniors from the burdens of being housing-cost burdened. Nearly 26% of seniors here are housing cost burdened, an average rate.
But other than the slightly high rate of seniors who are housing-cost burdened, seniors are doing well. The First State ranks fifth for senior poverty rate, with a senior poverty rate of only 6.9%.
3. Indiana
The Hoosier state takes third. This state has one of the lowest average incomes for prospective retirees. But thanks to low cost of living, seniors here make it work. For starters only 22% of seniors here are housing-cost burdened the second-lowest rate in our top 10. On top of that Indiana also ranks in the top 11 for senior homeownership rate and percent of seniors using food stamps. Those rates of hardship are low partially due to Indiana’s affordability. We rank it as the 10th most affordable state in the country.
4. (tie) Michigan
Indiana’s northern neighbor, Michigan, occupies the fourth spot. According to data from the Census Bureau, 57% of Michigan senior households have some retirement income one of the highest rates in the country. Combine that with a low cost of living and it shouldn’t be a surprise that seniors in Michigan are prepared for a long retirement. Other notable scores include the 11th-highest homeownership rate for seniors and the 18th-lowest senior poverty rate. Overall Michigan ranks above average in all but one of our metrics.
4. (tie) Virginia
Virginia is a fairly high cost of living area, but seniors here are still prepared for retirement. We estimate that the average senior with retirement income pulls in about $52,700 per year. Census Bureau data also reveals that just under 56% of senior households have some chunk of retirement income saved up. Overall most seniors in Old Dominion are doing well for themselves even factoring in the higher than average cost of living. This state has the 13th-lowest senior poverty rate and the 12th-lowest rate of seniors using food stamps.
6. Alaska
Alaska is one of the most expensive places in the country. But seniors who do spend their retirement enjoying Alaska’s many gifts tend to be prepared for the task. Despite the high cost of living, Alaska has the lowest senior poverty rate at 4.2%. Seniors here are able to avoid poverty thanks to high incomes. This state ranks in the top six for both average retirement income and percent of seniors with private retirement income.
7. Wyoming
The Cowboy state takes the seventh spot. Seniors here are some of the most self-reliant in the study. Only 6.2% of seniors in Wyoming use food stamps, the lowest rate in our study, and only 8.5% of seniors fall under the poverty line. Plenty of seniors here are also invested in the local housing market. We estimate that just under 85% of all seniors own the home they live in. Apart from the increasing value of a home, homeownership in Wyoming brings another benefit: it lowers the long term cost of owning a home. Wyoming property taxes are some of the lowest in the nation, so seniors here who have paid off their mortgage are sitting pretty.
8. Missouri
Coming in eighth is Missouri. This is an affordable state to retire in. In fact, it ranks sixth in average cost of living. But our data shows that even factoring in the low cost of living, seniors here are well prepared for retirement. Missouri ranks in the top 20 in five out of seven metrics. Other than cost of living Missouri also ranks well in percent of seniors using food stamps and percent of seniors who are housing-cost burdened. Missouri ranks in the top 15 for both of those metrics.
9. Ohio
The majority of seniors in Ohio have done their part for preparing for retirement. According to our data this state has the fourth-highest rate of seniors with retirement income at just under 56%. Thanks to that high rate of seniors who started saving young, few seniors here end up in poverty. According to Census Bureau data just over 8% of seniors fall under the poverty line. The homeownership rate for seniors in Ohio falls a bit short unfortunately. Ohio ranks below average in that metric.
10. (tie) Iowa
Our list rounds out in Iowa. Seniors here do a great job of sticking to their budget. This state ranks in the top 10 for housing cost burdened rate, poverty rate and percent of seniors who use food stamps. The reason this state does not rank any higher is because there is little room for error in the average senior Iowan budget. This state ranks in the wrong half for average income and percent of residents in retirement income.
10. (tie) Kansas
Kansas has some of the most self-reliant seniors in our study. Our data shows that under 7% of seniors in Kansas are impoverished and less than 6% of seniors make use of food stamps to make ends meet. That is a sign that seniors did a great job of preparing for retirement. This state falls to 10th because although few Kansas seniors are impoverished, their average income is not high. The average senior household has about $42,600 in retirement income. Furthermore about 21% of senior households are renters leaving them vulnerable to any future rent increases.
Data and Methodology
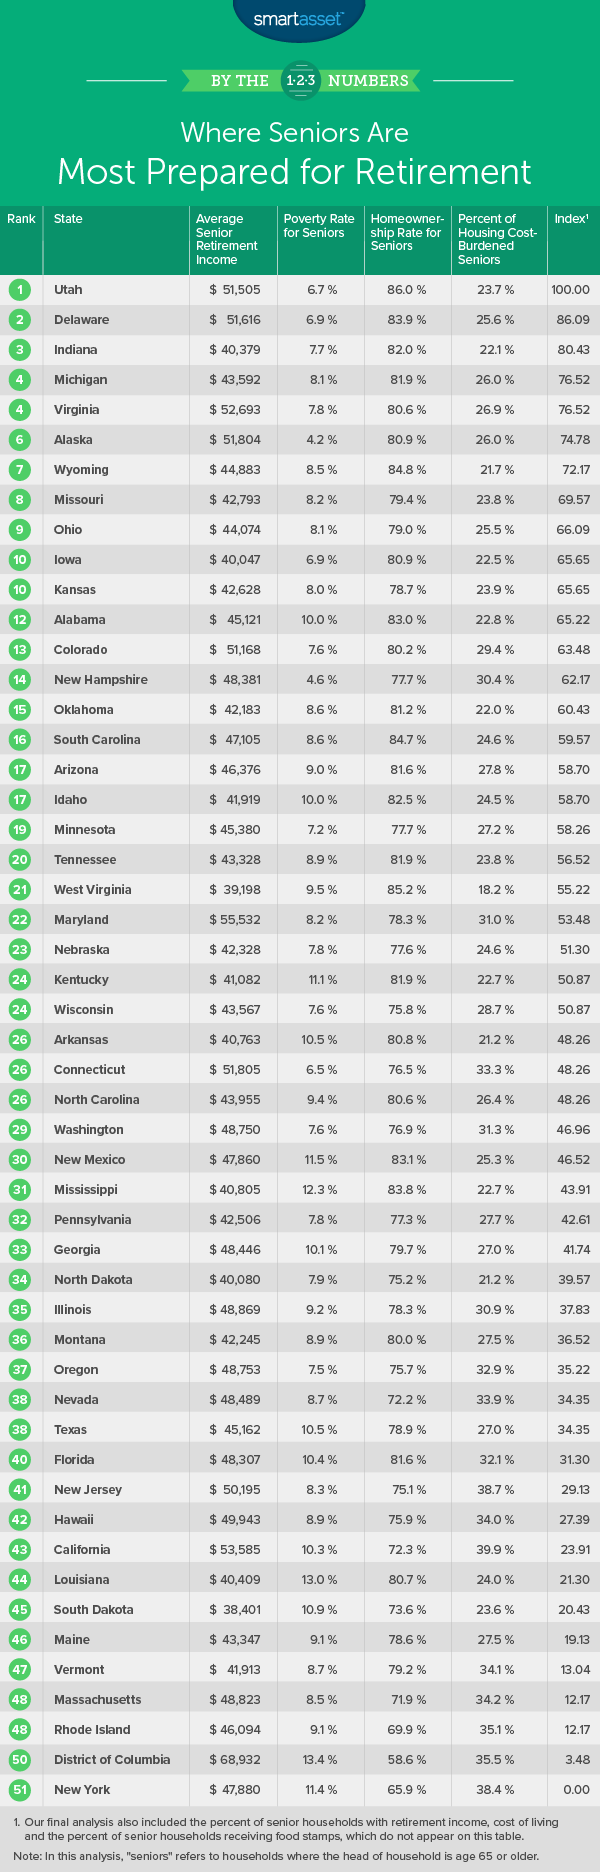
In order to rank the states where seniors are prepared for retirement, we looked at data for all 50 states and Washington, D.C. We then ranked them using the following six metrics:
- Average senior retirement income. This is private retirement income, from savings, IRA, 401(k) or pensions, combined with Social Security income for households where the head of household is 65 or older.
- Percent of seniors under the poverty line. This is the percent of seniors who fall under the poverty line.
- Percent of seniors who use food stamps/SNAP benefits. This is the percent of households who use food stamps where the head of household is 65 or over.
- Homeownership rate for seniors. This is the percent of households where the where the head of household is 65 or over and the home is owner-occupied.
- Percent of seniors with retirement income. This is the percent of households where the head of household is 65 or over who have retirement income from private means. It includes money from income streams like annuities, insurance, IRAs and retirement pensions.
- Percent of seniors who are housing cost-burdened. This is the percent of households where the head of household is 65 or over and spends 30% or more of income on housing.
- Cost of Living. This is the average cost of living across the state.
Data for all metrics comes from the U.S. Census Bureau’s 2016 1-Year American Community Survey except for cost of living which comes from The Council for Community and Economic Research.
Tips for Making Sure You’re ready for Retirement
- To give yourself the best chance of unlocking the highest rates of return for retirement, you probably want to talk to an expert. Finding the right financial advisor that fits your needs doesn’t have to be hard. SmartAsset’s free tool matches you with financial advisors in your area in 5 minutes. If you’re ready to be matched with local advisors that will help you achieve your financial goals, get started now.
- When it comes to saving for retirement there is no substitute for starting early. For example, using our investment calculator we can see that investing $5,000 today with a rate of return of 5% would be worth $8,144 after 10 years. After 20 years, it would be worth $13,266. Had you not invested your $5,000 20 years ago, you would have needed to save an additional $8,266 to be on the same track.
Questions about our study? Contact us at press@smartasset.com.
Photo credit: ©iStock.com/adamkaz