 Written by
A 2021 survey from the staffing and recruitment firm Robert Half says that 44% of professionals reported feeling burnt out at their jobs. That’s a 10% jump from one year ago, when the COVID-19 pandemic disrupted the economy. This year, a record 3.8 million U.S. employees quit their private-sector jobs in April 2021 – and are still leaving their jobs at a breakneck pace. The national quit rate, or percentage of workers quitting their jobs each month, crested at an all-time high of 3.1% in April and remained at 3% in June. For perspective, roughly an average of 2.5 million left their jobs every month between January 2001 and December 2020, well below the 3.7 million who gave their two weeks’ notice in June 2021 alone.
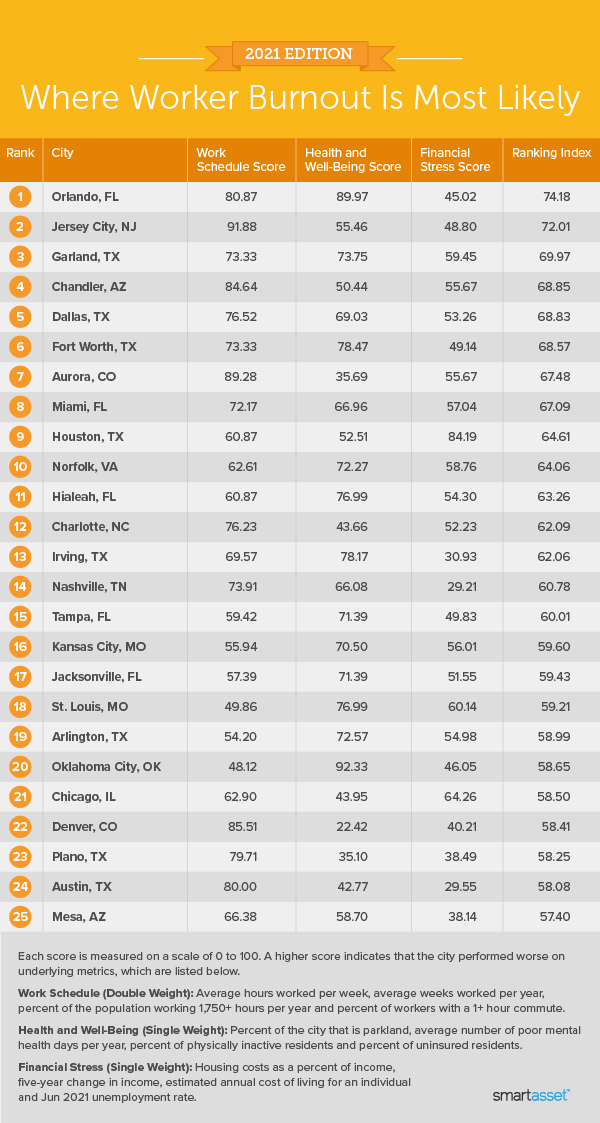
Keeping this mind, SmartAsset set out to determine where in the U.S. worker burnout is most likely. We studied 100 of the largest cities in the country and examined 12 different metrics across three distinct categories: work schedule, health & well-being and financial stress. For details on our data sources and how we put all the information together to create our final rankings, read the Data and Methodology section below.
Key Findings
- Burnout is more likely in Florida and Texas. Out of the 25 cities where worker burnout is most likely, 13 are located in Florida and Texas – including six in the top 10. Our data shows that workers in nine of these cities are working more hours per week than those in 80% of the 100 cities that we studied.
- Where are workers working 40+ hours? Workers in the 100 cities we studied log an average of 38.7 hours per week. But in six of the first 25 cities in the ranking, the average number of hours worked per week is equal to or exceeds 40: Orlando, Florida; Dallas, Fort Worth, Houston and Irving, Texas; and Denver, Colorado.
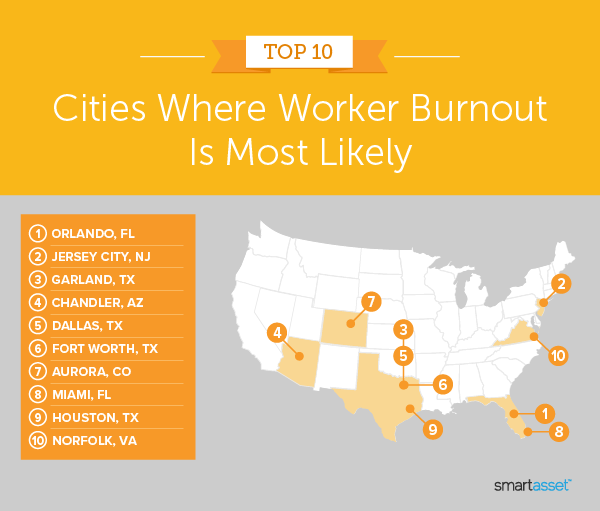
1. Orlando, FL
Orlando is the city where worker burnout is most likely in 2021. The Central Florida locale ranks fourth-lowest for its health and well-being score. Within that category, Orlando has the seventh-highest percentage of residents who are physically inactive (26.8%) and the eighth-highest number of poor mental health days per year (5.0).
2. Jersey City, NJ
Located across the Hudson River from Manhattan, Jersey City garnered the third-worst work schedule score in the study. Nearly 61% of workers in Jersey City work more than 1,750 hours per year, the fifth-highest rate for this metric overall. Meanwhile, a whopping 20.1% of workers have a commute longer than one hour (third-highest).
3. Garland, TX
The labor force in Garland, Texas, which is part of the Dallas-Fort Worth Metroplex, works an average of 39.7 hours per week, tied for the 20th-highest across our study. However, the health and well-being score shows that this city has the second-highest percentage of uninsured residents (26.6%). Financial stress metrics rank Garland as having the 17th-lowest five-year change in income (16.55%) of all 100 cities in the study.
4. Chandler, AZ
Over 60% of the population of Chandler, Arizona works more than 1,750 hours per year, seventh-highest among all 100 cities in our study. Residents of this Phoenix suburb also work an average of 38.7 weeks per year and 39.7 hours per week, 10th- and 20th-highest across our study, respectively. As a result, Chandler has the sixth-worst score for work schedule.
5. Dallas, TX
Workers in Dallas, Texas average more hours per week (40.5) than their counterparts in 97 other cities across our study. Meanwhile, the health and well-being score indicates that Dallas also has the fourth-highest percentage of uninsured residents (24.6%).
6. Fort Worth, TX
On average, workers in Fort Worth, Texas log the seventh-highest number of hours per week (40.1). The health and well-being score indicates that not only does this city have the eighth-highest percentage of uninsured residents (19.4%), but also only 5.76% of Fort Worth is designated parkland (ranking in the bottom 25th percentile for that metric).
7. Aurora, CO
Aurora, Colorado recorded the fourth-worst score for work schedule in the study, due in part to 60.0% of its population working more than 1,750 hours per year (10th-highest). Workers in Aurora log an average of 39.9 hours per week and 38.4 weeks per year (13th- and 15th-highest number of hours, respectively).
8. Miami, FL
Miami, Florida has the 13th-highest percentage of the population working more than 1,750 hours per year (59.1%). Financial stress metrics show that this city’s housing costs are a larger percentage of income (36.31% – indicating that residents are housing cost-burdened) than any other city in our study. And the health and well-being score places Miami as having the 10th-highest percentage of uninsured residents across all 100 cities (19.0%).
9. Houston, TX
Another Texas hotspot for potential worker burnout, Houston ranks seventh-worst for financial stress. This category includes housing costs as a percentage of income, five-year change in income, estimated annual cost of living for an individual and unemployment. Houston has the 16th-lowest five-year change in income (15.38%). Additionally, metrics for health and well-being also show that it has the third-highest percentage of uninsured residents (25.2%).
10. Norfolk, VA
Workers in Norfolk, Virginia log an average of 39.7 hours per week, tied for 20th-most across our study. Meanwhile, only 5.37% of Norfolk is designated as parkland, which is the 20th-lowest rate for this metric out of the 100 cities included in our study.
Data and Methodology
To determine the cities where worker burnout is most likely, we examined 100 of the largest cities in the U.S. and compared them across these three categories:
- Work schedule. This category comprises the following four metrics: average weeks worked per year, average hours worked per week, percentage of population working more than 1,750 hours per year and percentage of workers with a long commute. We gave a double weighting to this score, making it the most important category of metrics in our study. Data comes from the Census Bureau’s 2019 1-year American Community Survey
- Health and well-being. This category comprises the following metrics: percentage of city that is parkland, average number of poor mental health days, percentage of physically inactive residents and percentage of uninsured residents. Data comes from the 2021 County Health Rankings and the Trust for Public Land’s 2020 Acreage & Park System Highlights.
- Financial stress. This category comprises the following metrics: housing costs as a percentage of income, five-year change in income, estimated annual cost of living for an individual and the June 2021 unemployment rate. Data comes from the 1-year American Community Surveys from 2014 and 2019, the MIT Cost of Living Calculator and the Bureau of Labor Statistics.
We ranked each city in every metric and found an average ranking and score for each category. We then found a final score, assigning the score for work schedule a double weight and averaging the three category scores. The city with the highest cumulative score ranked at the top of our list.
Tips for Switching Careers
- Build an emergency fund. Having between three and six months worth of savings in place can make switching careers less scary, especially if you don’t have a job lined up immediately. Use SmartAsset’s savings calculator to see how your emergency fund is coming along and how far you have to go to reach your savings goal.
- Do your research. If you’re contemplating a career change, be sure to do plenty of research about the new field you’re planning to enter. Start by checking out the Occupational Outlook Handbook published by the Bureau of Labor Statistics, which features detailed information on hundreds of occupations. From there, try looking on sites like Glassdoor or Indeed to read company reviews from former employees.
- Consult a professional. While a financial advisor may not be able to give you relevant career advice, they can help you determine the right time to make a big change in your life based on your financial picture. SmartAsset’s free tool can match you with financial advisors in your area in a matter of minutes. If you’re ready to be paired with local advisors, get started now.
Questions about our study? Contact us at press@smartasset.com.
Photo credit: ©iStock.com/Tetiana Soares