 Written by
Social Security benefits and housing expenses are two of the most important elements of a successful financial plan in retirement. While Social Security is the primary source of income for many retirees, housing can be their biggest monthly expense.
According to Census Bureau data, the average Social Security beneficiary collects $19,792 per year. That’s 1.5-times more than the median annual housing cost of $13,188. However, that ratio is even larger in some cities, while other places with higher costs of living, including many cities in California, often have ratios far below the national average.
In this study, we examine the average Social Security income for 100 cities to determine where benefits are highest and lowest relative to local housing costs. We compare cities across the following metrics: average annual Social Security income, median monthly housing costs and median annual housing costs. For details on our data sources and how we ranked areas, read our Data and Methodology section below.
Key Findings
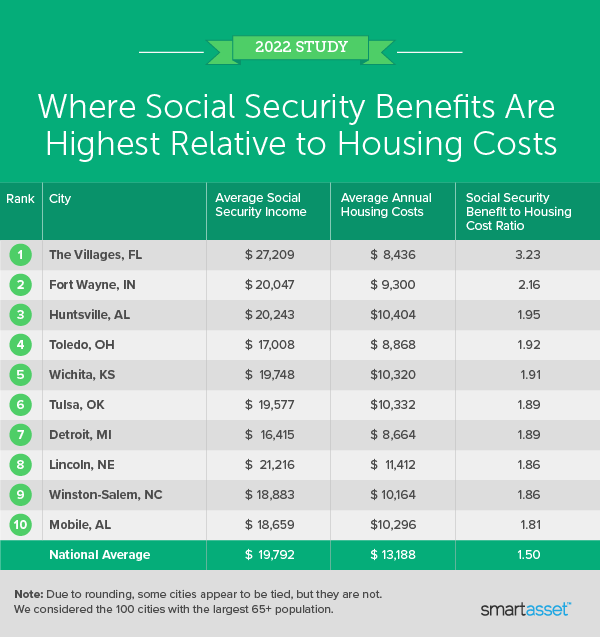
- Social Security benefits are three times higher than housing costs in a Florida retirement community. Retirees in The Villages, a Census designated place (CDP) in central Florida, enjoy what is by far the largest gap between the Social Security benefits and housing costs. While the average national annual Social Security benefit is $19,792, the average beneficiary in this sprawling retirement community collects more than $27,000 a year in Social Security. Meanwhile, housing costs in The Villages are 36% less than the national average.
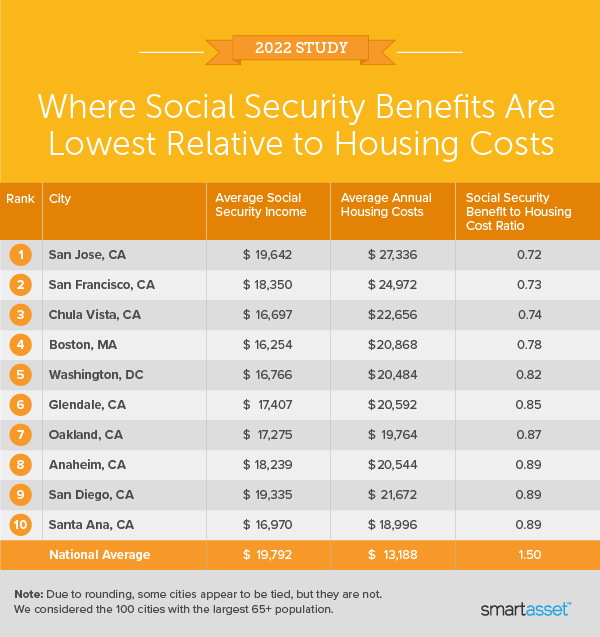
- California Dreaming … of lower housing costs. Median monthly housing costs are higher than the average Social Security income in 17 out of the 100 total cities that we analyzed. Of those 17 cities, 11 are located in California. Two cities in the Golden State with notoriously expensive real estate – San Jose and San Francisco – rank as the top two cities where Social Security benefits are lowest relative to housing costs.
Where Social Security Benefits Are Highest Relative to Local Housing Costs
1. The Villages, FL
The Villages, Florida has the highest average Social Security income relative to housing costs, as the average annual benefit is 3.23 times more than the median housing costs. As a retirement destination, nearly 82% of the population of The Villages is over the age of 65. Meanwhile, The Villages has the highest average Social Security income ($27,209) and the lowest median housing costs ($8,436) of all 100 cities we examined.
2. Fort Wayne, IN
The average annual Social Security income in Fort Wayne, Indiana is 2.16 times greater than median housing costs, which is the second-highest ratio of the 100 cities we studied. This city of over 265,000 residents has the 19th-highest average annual Social Security income ($20,047) and the sixth-lowest median annual housing costs ($9,300).
3. Huntsville, AL
Huntsville, Alabama has the third-highest Social Security income compared to local housing costs of the 100 cities in our study. While 16% of the population of this northern Alabama city is over the age of 65, Social Security beneficiaries there have the 13th-highest average annual payments ($20,243). Median housing costs are also relatively low, at just $10,404 per year (15th-lowest). As a result, Huntsville has the third-highest ratio of average Social Security income to median housing costs (1.95) across our study.
4. Toledo, OH
Toledo, Ohio ranks near the bottom for average annual Social Security income ($17,008), but retirees in this city of over 276,000 residents benefit from relatively low housing costs. The median housing costs in Toledo are just $8,868 per year, fourth-lowest across our study. As a result, average Social Security benefits in Toledo are 1.92 times greater than median annual housing costs.
5. Wichita, KS
Wichita, Kansas ranks 24th for average Social Security income ($19,748), while its median annual housing costs ($10,320) are 12th-lowest among all 100 cities we studied. That means the city’s average Social Security benefits are 1.91-times larger than its median housing costs, fifth-highest across our study.
Where Social Security Benefits Are Lowest Relative to Local Housing Costs
1. San Jose, CA
In this tech hub of the San Francisco Bay Area, the average Social Security beneficiary collects $19,642 annually, but must contend with median housing costs that reach $27,336 per year, highest of the 100 cities that we studied. That means the ratio between average Social Security income and median annual housing costs is just 0.72, the lowest in our study.
2. San Francisco, CA
At $24,972 per year, median annual housing costs in San Francisco are second-highest in our study, while the average Social Security income there ($18,350) ranks in the bottom half of cities. As a result, the ratio between average Social Security payments and median housing costs is 0.73, the second-lowest across all 100 cities we studied.
3. Chula Vista, CA
Chula Vista, California has some of the highest median housing costs and lowest average Social Security income in our study. The ratio between the two metrics is just 0.74, the third-lowest of all 100 cities we examined. Social Security beneficiaries in Chula Vista, on average, collect only $16,697 per year, the 88th-lowest out of all 100 cities. Meanwhile, the city’s median housing costs are the fourth-highest at $22,656 per year.
4. Boston, MA
The ratio between average annual Social Security benefits and median annual housing costs in Boston is 0.78, the fourth-lowest across our study. The average Social Security beneficiary collects only $16,254 per year in Beantown (92nd), while the city’s median housing costs are $20,868 per year, the seventh-highest.
5. Washington, D.C.
With the 10th-highest housing costs ($20,484) and average Social Security benefits that rank 83rd overall ($16,766), Washington D.C. has the fifth-smallest Social-Security-to-housing-costs ratio. The average annual income derived from Social Security in Washington D.C. covers just 82% of the median annual housing costs there.
Data and Methodology
To find the cities where Social Security benefits are highest and lowest relative to local housing costs, we looked at data for the 100 cities with the largest populations of residents ages 65 and older. We compared them across following three metrics:
- Average Social Security income. This is the average amount of Social Security benefits collected in a year. Data comes from the Census Bureau’s 5-year American Community Survey from 2019.
- Median annual housing costs. This is the median annual housing costs for both homeowners and renters. We calculated this figure using median monthly housing costs from the Census Bureau’s 5-Year American Community Survey from 2019.
To compile our rankings, we divided average annual the Social Security benefits by median annual housing costs for each city. The resulting number is the ratio the rankings are based on.
Tips for Maximizing Social Security
- Work with a professional. A financial advisor can work with you to determine the optimal time for you to start claiming Social Security. Finding a qualified financial advisor doesn’t have to be hard. SmartAsset’s free tool matches you with up to three financial advisors in your area, and you can interview your advisor matches at no cost to decide which one is right for you. If you’re ready to find an advisor who can help you achieve your financial goals, get started now.
- The longer you wait, the more you get. Using SmartAsset’s Social Security Calculator, you’ll see that your benefits will increase the longer you wait before you start claiming them. If you delay Social Security beyond your full retirement age, your benefits will increase by 0.66% each month (for those born after 1943) until you turn 70.
Questions about our study? Contact us at press@smartasset.com
Photo credit: ©iStock.com/Katleho Seisa