
Buying a home has become increasingly difficult during COVID-19. Though low mortgage rates mean that many purchasers will spend less in interest over the course of their mortgage, home prices have risen and housing inventory has dropped. According to data from the National Association of Realtors, the median existing-home price rose by 17.2% from March 2020 to March 2021. Over the same time, the number of units available for purchase decreased by 28.2%. SmartAsset has identified and ranked the hardest places to buy a home.
In this study, we analyzed data across the 50 largest metro areas, accounting for affordability, inventory and pricing. Specifically, we looked at down payment-to-income ratio, number of homes on the market compared to number of households and the average price cut for homes that sold recently. For details on our data sources and how we put all the information together to create our final rankings, check out the Data and Methodology section below.
This is SmartAsset’s second annual study on the hardest places to buy a home. The 2020 version, which was conducted at the city level, can be found here.
Key Findings
- West Coast metro areas make up most of the top 10. Nine of the 10 places where it is hardest to buy a home are in the West, and seven of those are on the coast. They include five California locales along with the Seattle, Washington and Portland, Oregon metro areas. Though price cuts are occasionally available in those seven areas, they consistently rank poorly in the categories of affordability and inventory. Among those seven West Coast metro areas, the Portland, Oregon metro area is the easiest location to buy a home – though its down payment-to-income ratio still exceeds 1.00 and there are fewer than 94 homes for sale for every 10,000 households.
- A down payment may cost more than your annual, pre-tax salary. In 13 of the 50 metro areas in our study, the down payment-to-income ratio is greater than 1.00. This means that a 20% down payment on the median-valued home in the area is higher than the area’s median household income. Nationally, the down payment-to-income ratio is 0.73.
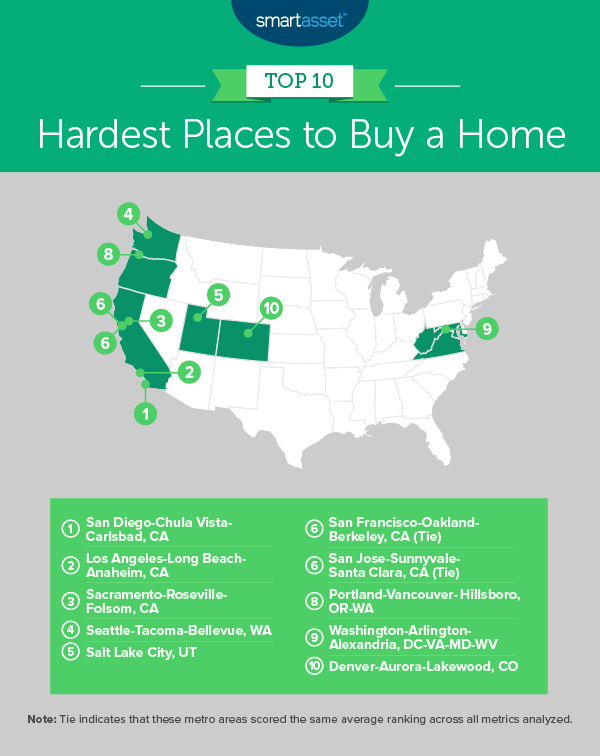
1. San Diego-Chula Vista-Carlsbad, CA
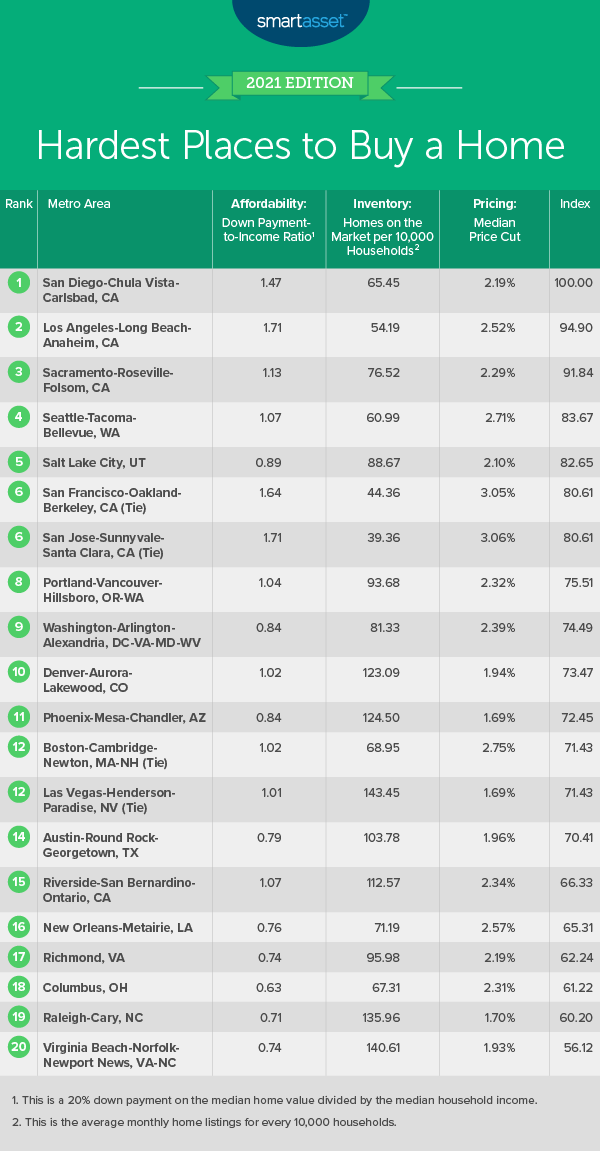
San Diego-Chula Vista-Carlsbad, California has a competitive real estate market. It ranks in the bottom 20 metro areas for all three metrics: affordability, inventory and pricing. Specifically, San Diego-Chula Vista-Carlsbad has the fourth-highest down payment-to-income ratio (1.47), the seventh-lowest average number of homes for sale in a month for every 10,000 households (65.45) and the 18th-lowest average price cut for home sales (2.19%).
2. Los Angeles-Long Beach-Anaheim, CA
Los Angeles-Long Beach-Anaheim, California has the highest down payment-to-income ratio in our study, at 1.71. The area also ranks poorly when it comes to the number of homes available for purchase. Using Zillow and Census Bureau data, we found that fewer than 55 homes were for sale on average each month in 2020 for every 10,000 households. Relative to the other metro areas in the study, this is the fourth-lowest rate.
3. Sacramento-Roseville-Folsom, CA
Sacramento-Roseville-Folsom, California ranks in the bottom 40% of metro areas for all three metrics. It had the sixth-highest down payment-to-income ratio (1.13), the 11th-lowest average number of homes for sale in a month for every 10,000 households (76.52) and the 20th-lowest average price cut for home sales (2.29%).
4. Seattle-Tacoma-Bellevue, WA
In Seattle-Tacoma-Bellevue, Washington, the median home value is $503,000 and the median household income is about $94,000. This means that the area has a down payment-to-income ratio of 1.07, the seventh-highest in our study. Seattle-Tacoma-Bellevue also has the fifth-lowest inventory, with fewer than 61 homes per 10,000 households for sale each month.
5. Salt Lake City, UT
Salt Lake City, Utah ranks in the bottom 20 metros for all three of our study metrics. The median price cut is 2.10%, the 15th-lowest across all 50 areas. And roughly 89 homes per 10,000 households are for sale each month, the 17th-lowest rate. Finally, though the down payment-to-income ratio does not exceed 1.00, it is the 14th-highest across all areas, at 0.89.
6. San Francisco-Oakland-Berkeley, CA (tie)
Housing inventory is extremely low in San Francisco-Oakland-Berkeley, California relative to the number of residents. Using Zillow and Census Bureau data, we found that fewer than 45 homes per 10,000 households were for sale each month in 2020. The average down payment on a home in San Francisco-Oakland-Berkeley also greatly exceeds the average household income. Data shows that the down payment to income ratio was 1.64, the third-highest in our study.
6. San Jose-Sunnyvale-Santa Clara, CA (tie)
San Jose-Sunnyvale-Santa Clara, California ties with San Francisco-Oakland-Berkeley, California as the sixth-hardest metro area to buy a home. While homebuyers seem to have more negotiating power in San Jose-Sunnyvale-Santa Clara, it is very expensive when it comes to housing and inventory is low. At 1.71, the down payment-to-income ratio is the second-highest in our study. Inventory there is the lowest overall, with fewer than 40 homes per 10,000 households for sale each month.
8. Portland-Vancouver-Hillsboro, OR-WA
According to Census Bureau data, Portland-Vancouver-Hillsboro, Oregon-Washington has the 10th-highest down payment-to-income ratio out of the 50 largest metro areas (1.04). Homebuyers in the Portland area also may find it more difficult to get a deal. The median price cut on homes in the area is 2.32%, the 22nd-lowest overall.
9. Washington-Arlington-Alexandria, DC-VA-MD-WV
The Washington-Arlington-Alexandria metro area ranks in the middle of the 50 areas in our study in terms of price cuts. However, it ranks in the bottom third of places when it comes to inventory and affordability. We estimate that there are about 81 homes per 10,000 households for sale each month and the down payment-to-income ratio is 0.84.
10. Denver-Aurora-Lakewood, CO
Denver-Aurora-Lakewood, Colorado rounds out our list of the top 10 hardest places to buy a home. The area does not perform particularly well when it comes to affordability and pricing. The down payment-to-income ratio is 1.02, the 11th-highest in our study. Furthermore, the median price cut is 1.94%, the eighth-lowest overall.
Data and Methodology
To find the places where it is hardest to buy a home, SmartAsset looked at data for 50 largest metro areas in the U.S. We compared them across the following three metrics:
- Affordability: down payment-to-income ratio. This is a 20% down payment on the median valued home divided by the median household income. Data comes from the Census Bureau’s 2019 1-year American Community Survey.
- Inventory: average houses on the market during a month for every 10,000 households. Data on number of homes for sale comes from Zillow and is for the average in a given month during 2020. Data on the number of households in each city comes from the Census Bureau’s 2019 1-year American Community Survey.
- Pricing: median price cut. This is the median price cut on homes that were sold. Data comes from Zillow and is for 2020.
We ranked each metro area in every metric, giving a full weighting to all metrics. We then found each area’s average ranking and used the average to determine a final score. The metro area with the highest average ranking received a score of 100. The metro area with the lowest average ranking received a score of 0.
Home Buying Tips
- Calculate the full costs. Though a mortgage is typically the largest expense for homeowners, other costs like property taxes and home insurance can add up. Our comprehensive home buying guide has a property tax calculator, budget calculator and many informative articles that can help you make smart decisions regarding housing.
- Remember to negotiate. Many of the places on our list rank poorly in part because buyers are not able to negotiate prices downward. If you want more guidance on making an offer on a home and steps to follow, our guide can help.
- Consider consulting a financial advisor before going through the home-buying process. Finding the right financial advisor that fits your needs doesn’t have to be hard. SmartAsset’s free tool matches you with financial advisors in five minutes. If you’re ready to be matched with advisors that may be able to help you achieve your financial goals, get started now.
Questions about our study? Contact us at press@smartasset.com.
Photo credits: ©iStock.com/Art Wager