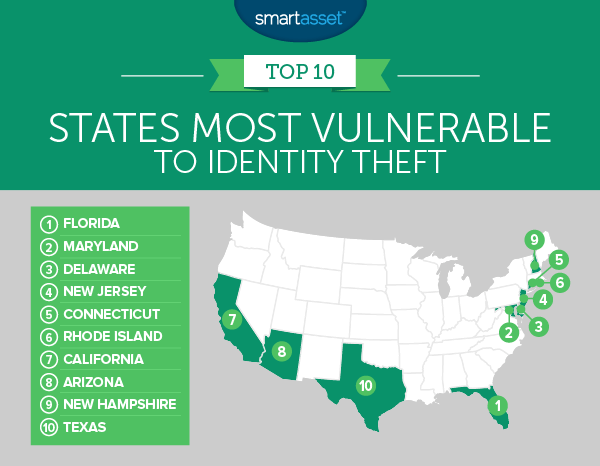
Identity theft is a major problem in the U.S. Over 15 million people were victims of identity theft in 2016, a 15% increase from the year before. While everyone is at risk of having their identity stolen, some people are at increased risk. This is especially true when you look at state data. Some states have more elderly residents, one of the most targeted groups for identity theft, or have wealthier households, another prime candidate for attempted identity theft.
Check out the best rewards credit cards.
In order to find the states most vulnerable to identity theft, SmartAsset looked at data on identity fraud complaints, identity theft complaints, percent of the population under the age of 10 or over 65, average number of open credit cards per resident and the percent of households with an income over $74,999. To see where we got our data and how we put it together, check the data and methodology section below.
Key Findings
- Retirement states – The two most popular retirement states in the country, Arizona and Florida, are also some of the most vulnerable to identity theft. Florida ranked first overall and Arizona ranked eighth.
- Identity theft doesn’t discriminate – Whether you’re old or young, rich or poor, identity theft can happen to anyone. But that doesn’t mean becoming a hermit is your only way to protect yourself, there are ways to stay safe while leading an active financial life. Monitoring your credit report is a great start to catch identity fraud before it becomes a problem.

1. Florida
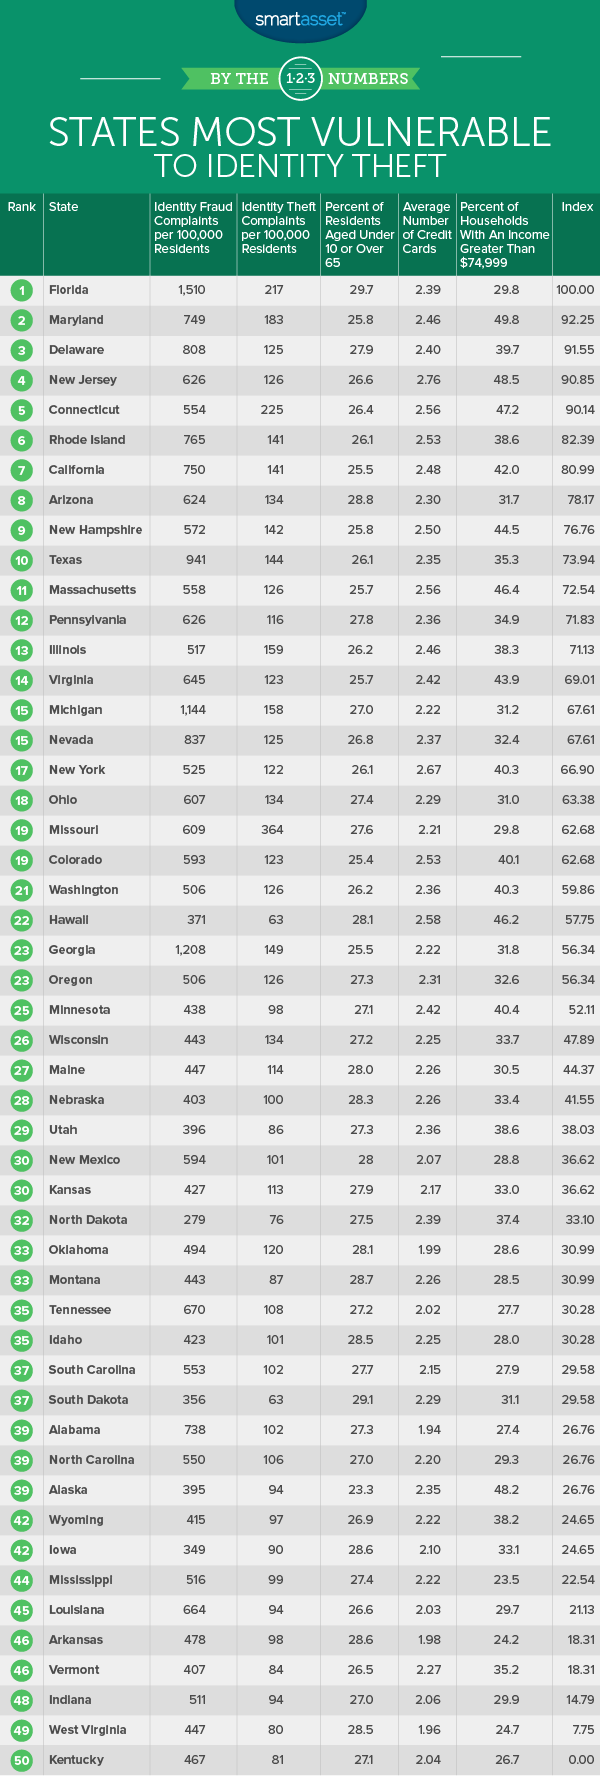
Florida ranks as the nation’s most identity theft prone state, according to our data. The Sunshine State ranked first in in identity fraud complaint rate and third in identity theft complaint rate, which suggest the state may be heavily targeted by identity thieves.
What may make Florida a juicy target is the large number of children and senior citizens in the state. Florida leads the nation in percent of residents who are under the age of 10 or over 65. Close to 30% of Florida’s population falls into these categories. Research shows these are among the most vulnerable citizens.
2. Maryland
Maryland is another state which appears to have a target on its back. Residents of the Old Line State complained about both identity fraud and identity theft to the FTC at top 10 rates. While Maryland does not have a large number of residents who fit the age profile of those most vulnerable to identity theft – only 25% of Marylanders are under 10 or over 65 – it does have a large proportion of high earners.
For people looking to steal credit card information, it’s safe to assume they want the credit card information of a wealthy person. Maryland has the highest percentage of households in the country who make over $74,999 per year, making them a potential target.
3. Delaware
With 807 identity fraud complaints per 100,000 residents, Delaware had one of the highest identity fraud complaint rates in the country. Delaware has the third-highest percent of residents inside the at-risk age brackets in the top 10. Just under 28% of Delaware residents are under 10 or over 65.
The state also has a high number of average credit cards per resident. While having many open credit cards is not necessarily a bad thing on its own – having multiple credit cards may allow one to optimize rewards, for example – it could increase the chance of having your identity stolen.
4. New Jersey
New Jersey residents have two things which may make them likely targets for identity theft. First, they have a relatively wealthy population. Just under half of households in New Jersey make more than $74,999 and on average New Jersey residents each have 2.76 open credit cards. For those two metrics, New Jersey ranks second and first, respectively.
5. Connecticut
The Constitution State comes in fifth for states most vulnerable to identity theft. This state has the second-highest identity theft complaint rate. Connecticut residents are also more vulnerable because of the average number of credit cards the state’s residents have. Our data shows that, on average, Connecticut residents have 2.56 open credit cards. That’s fourth-highest rate in the nation. Plus, Connecticut residents are some of the wealthiest. Just over 47% of Connecticut households make over $74,999 per year.
6. Rhode Island
The smallest state in the union is home to some of the most vulnerable residents to identity theft. Residents of Rhode Island complain to the FTC about identity fraud at a rate of 765 complaints per 100,000 residents and about identity theft at a rate of 141 complaints per 100,000 residents. For both those metrics Rhode Island ranks in the top 10.
Rhode Islanders have the sixth-highest average number of open credit cards in the country. If you think your identity was stolen through one of your credit cards and are not receiving much support from your financial institution, the Consumer Financial Protection Bureau (CFPB) might be able to help. One of the most common financial complaints that it receives is about identity theft linked to credit cards.
7. California
Did you know that California has the highest debt-to-income ratio of any state in the country? A large chunk of that debt is held over multiple credit cards. Californians, on average, have 2.48 open credit cards, the ninth-most in the country. If you do have a lot of credit cards, make sure you are carefully checking all your monthly statements to look for any transactions which you did not make.
8. Arizona
One of the most popular states for retirees is also one of the most targeted by identity thieves. Data from the FTC shows that Arizona complained about identity fraud at the 14th-highest rate and about identity theft at the 16th-highest rate. Arizona residents are also right in the most vulnerable age range. Census data shows that 28.8% of Arizona residents are under the age of 10 or over the age of 65. Both demographics that identity thieves tend to target.
Young children are vulnerable because they have no way of protecting themselves and if they do have their identity stolen, they often do not find out for many years. By then the damage is already done. One way to help protect your child’s identity is to set up a credit file for them and check it regularly.
9. New Hampshire
New Hampshire residents have some of the highest proportion of high income earning households in the country. Our data shows that 44.5% of New Hampshire households earn over $74,999. Residents of the Granite State also tend to have a lot of plastic. The average New Hampshire residents has 2.5 open credit cards.
10. Texas
Texas closes out our top 10. Texans complained to the FTC about identity theft and identity fraud at top 10 rates. Many households in Texas are relatively wealthy, which may make them bigger targets of identity thieves. Over 35% of households in Texas earn more than $74,999.

Data and Methodology
In order to find the states most vulnerable to identity theft, we looked at data on all 50 states. Specifically we looked at data on the following five factors:
- Identity theft complaints per 100,000 residents. Data comes from the Federal Trade Commission’s 2015 summary of consumer complaints.
- Identity fraud complaints per 100,000 residents. Data comes from the Federal Trade Commission’s 2015 summary of consumer complaints.
- Percent of households earning over $74,999. We chose this as a metric because research from the AARP has shown that higher earning residents tend to be at higher risk of an identity breach. Data comes from the U.S. Census Bureau’s 2015 5-Year American Community Survey.
- Percent of population under age 10 or over 65. Research has shown that children and seniors tend to be the most at risk of identity theft. Data comes from the U.S. Census Bureau’s 2015 5-Year American Community Survey.
- Number of credit cards. This is the average number of credit cards per person in each state. Data comes from Experian’s 2016 State of Credit report.
We ranked each state across each of the five metrics, giving equal weight to each metric. Then we found the average ranking for each state. Last, we used this average ranking to create our final score. The state with the best average ranking received a score of 100. While the state with the worst average ranking received a score of 0.
Questions about our study? Contact us at press@smartasset.com.
Photo credit: ©iStock.com/Michael Krinke
