 April 1, 2020 marked the original self-response deadline of the 24th Census in the U.S. As mandated by the constitution, the decennial count determines how many congressional seats each state gets, and this year will help inform the distribution of $1.50 trillion in federal funding. Beyond this, data collected by the Census is used regularly within public and private sectors. For instance, Medicare and Medicaid programs rely on the data to allocate funds across communities, while here at SmartAsset we use Census data to provide many free calculators to Americans and help them make smart financial decisions.
The Census Bureau largely depends on Americans to respond on their own and categorizes this portion of the population as “self-responding.” While there are many factors that come into play when considering how likely a household is to respond – such as immigration status, homelessness, poverty, education levels, age and disability – the Census has put a system in place to ensure that households that do not respond receive follow-ups. Though Census workers conduct these follow-ups via phone calls and in-person visits, households that self-respond help the Census Bureau save time and money while it continues to collect data. During the current global coronavirus pandemic, self-responses have become all the more imperative, as nonresponse follow-ups are increasingly difficult to conduct. April 1, Census Day – the day by which households are highly encouraged to reply – has passed. However, Census self-response operations, which typically last through mid-summer, will now continue through the end of October in 2020.
In this study, SmartAsset took a closer look at the 2020 Census and current self-response rates as of May 4, 2020. We compared data from the 2010 Census to this year’s count and analyzed self-response rates for 2020 thus far. Additionally, as 2020 is the first year that households can respond online, we examine the states and cities where the highest numbers of respondents are filling out the questionnaire online. For details on our data sources and how we put the information together to establish our findings, check out the Data and Methodology section below.
Key Findings
- Coronavirus has impacted key 2020 Census dates. Similar to its impact on tax deadlines, the coronavirus pandemic has affected the originally scheduled timeline of the 2020 Census. With Census field operations largely stopping from mid-March through the beginning of May, the Census Bureau pushed back its deadline for completing the 2020 count from the end of July to the end of October.
- Four Midwestern states – Minnesota, Wisconsin, Iowa, and Nebraska – lead the pack. In both the 2000 and 2010 Census counts, Minnesota, Wisconsin, Iowa and Nebraska were the four states with the highest self-response rates. In 2020 so far, they continue to lead the 50 U.S. states. More than 63% of households in each of these four states have completed the questionnaire.
- In most states and cities, more than two-thirds of households responded online. 2020 marks the first time Census has had an online response option at my2020census.gov. Many households have capitalized on that option. In all states, except Arkansas and Mississippi, more than seven in 10 households that have responded have done so online. Similarly, across the 50 largest U.S. cities, Detroit, Michigan is the only one where less than 70% of households completed the questionnaire online.
Comparing the 2010 Census and 2020 Census
Though there are overlaps between places with high 2010 self-response rates and high 2020 self-response rates (e.g. Midwestern states), the two years are difficult to compare for several reasons. First, the 2020 Census is still in progress and has been delayed. During a typical decennial year, the self-response phase lasts through the end of July, with nonresponse follow-ups overlapping that period, taking place from mid-May through the end of July. In 2020, due to the damaging spread of coronavirus throughout the U.S., the self-response phase was extended to the end of October 2020. Moreover, nonresponse follow-ups, which are often conducted in person, are now scheduled to take place from mid-August through the end of October 2020.
Second, Census operations are different between the two years. In 2010, there was no online response option, and households received only two mail packets from the Census. In 2020, the Census Bureau introduced an online response option, and households will receive up to five mailings.
Mailings to all households:
- Mailing 1: Invitation letter, March 12-20, 2020
- Mailing 2: Reminder letter, March 16-24, 2020
Mailings to households that haven’t yet responded:
- Mailing 3: Reminder postcard, March 26-April 3, 2020
- Mailing 4: Reminder letter plus paper questionnaire, April 8-30, 2020
- Mailing 5: Final reminder postcard, April 27, 2020 – May 9, 2020
While the introduction of an online questionnaire option along with increased mailings may suggest that self-response rates in 2020 will be higher than they were in 2010, the COVID-19 pandemic may dampen or even negate the effects of those changes. While we will not be able to measure differences between the two years in any complete way until the 2020 Census is complete, the Census Bureau has begun publishing daily figures on self-response rates, which we take a look at below.
2020 Self-Response Rates
Self-Response Rates by State
Almost 57% of households across the country responded to the 2020 Census as of May 4, 2020. However, self-response rates vary by geography. As previously noted, the Midwestern states of Minnesota, Wisconsin, Iowa and Nebraska have the highest self-response rates thus far. In each of those four states, more than 63% of households have completed the questionnaire. By contrast, less than half of households have responded in eight states: Alaska, West Virginia, New Mexico, Maine, Wyoming, Vermont, Montana and Hawaii. The heat map below compares self-response rates across the 50 states.
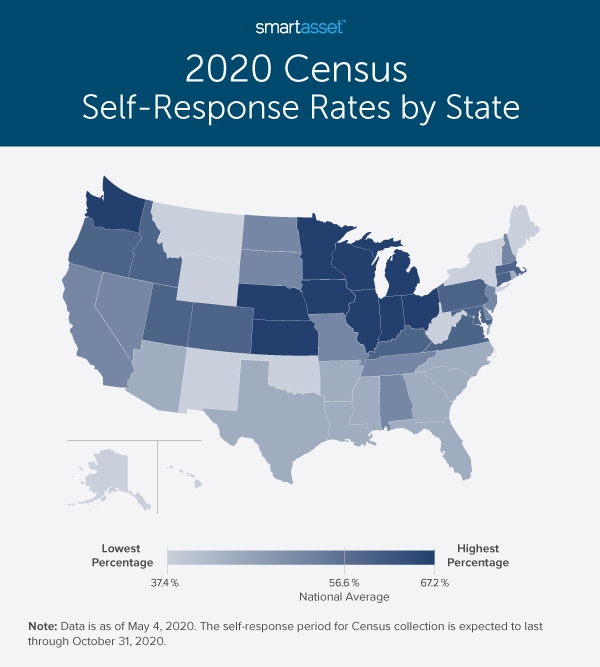
Beyond the top four Midwestern states with the highest self-response rates in the 2010 Census and thus far in the 2020 count, five more Midwestern states make it into the top 10 states with the highest response rates through the beginning of May this year. Those five states are Michigan, Illinois, Ohio, Kansas and Indiana. Washington State, ranking sixth overall, is the only state in the top 10 not located in the Midwest. As of May 4, 2020, 62.0% of households in Washington had completed their Census questionnaires.
Of the states with the lowest self-response rates, Alaska is at the bottom. As of May 4, 2020, only 37.4% of households in Alaska had responded to the 2020 Census, almost 7% lower than the state with the next lowest response rate, West Virginia. The state has historically had one of the lowest self-response rates, with much of the population living in remote areas. In fact, the Census Bureau notes that it begin operations early in Alaska “to reach parts…which may be difficult to reach later in the year and whose populations depart for other activities.”
Self-Response Rates by City
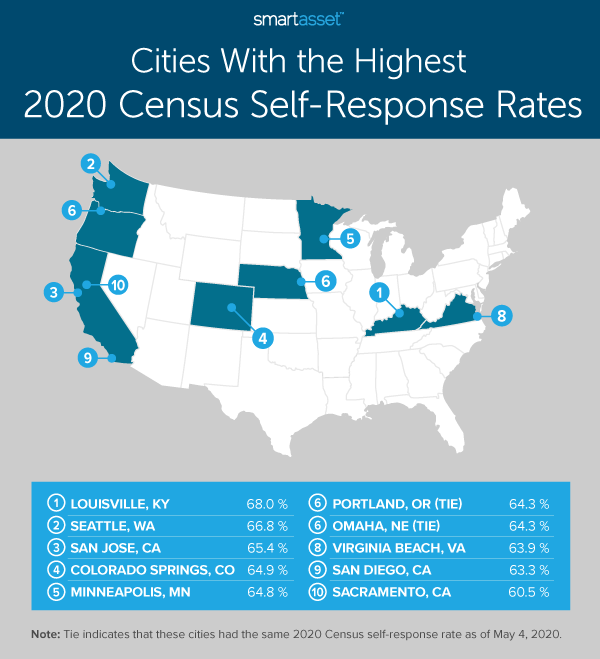
The top 10 cities with the highest Census self-response rates as of May 4, 2020 are more geographically diverse than the top-ranking states, as seen in the map below. There are two Midwestern cities, six Western cities and two Southern cities at the top of the list.
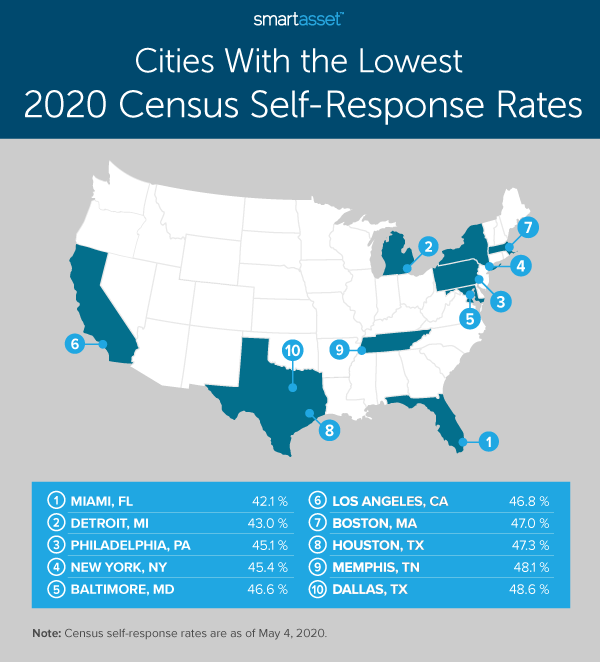
The most populous Northeastern cities fall behind in terms of Census self-response rates. Philadelphia, New York City and Boston all rank in the bottom 10, as seen below. As of May 4, 2020, less than 46% of households had responded to the 2020 Census online, by mail or by phone in both Philadelphia and New York City. In Boston, 47.0% of households had completed the questionnaire.
Census Responses Completed Online
Online Self-Response Rates by State
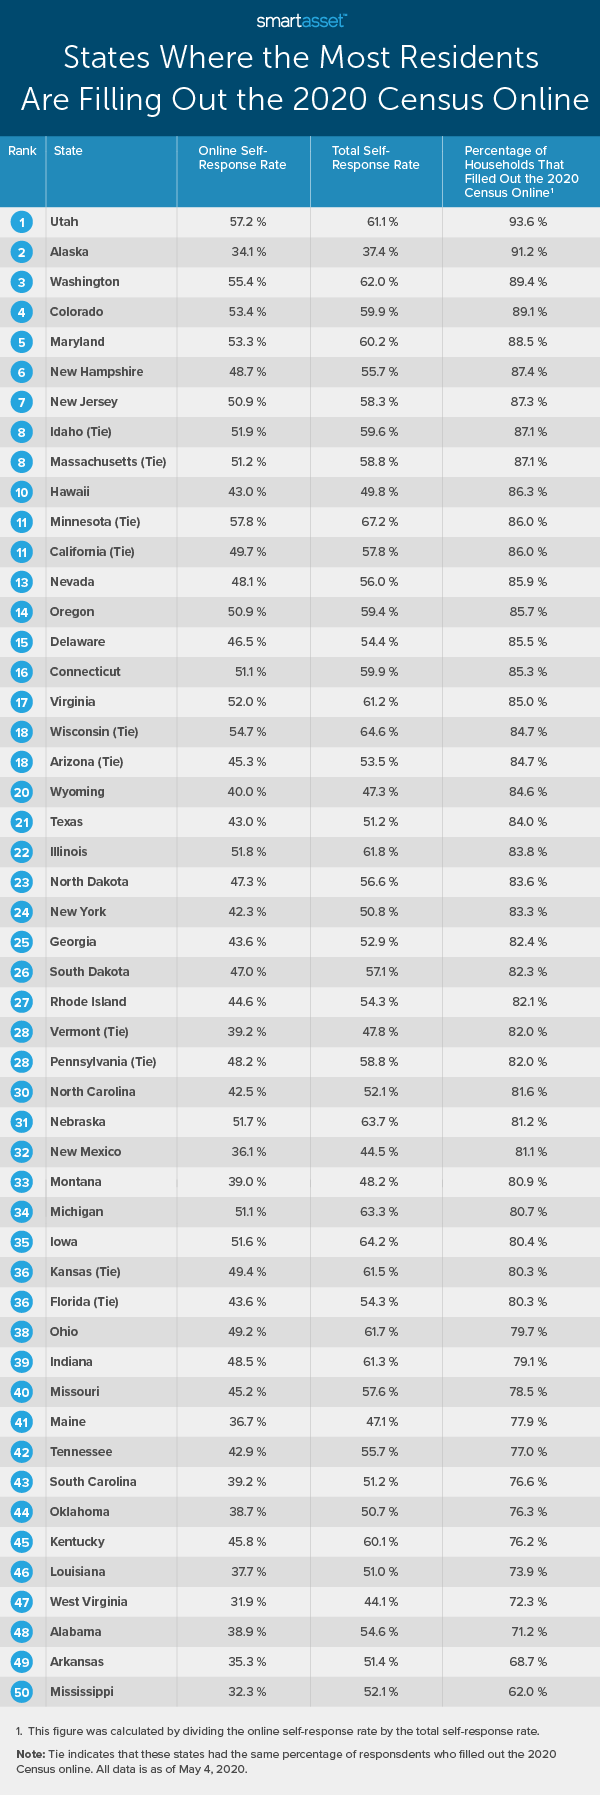
Nationally, 82.5% of questionnaires this calendar year have been completed via the online Census portal. Across states, that percentage ranges from 93.6% in Utah to only 62.0% in Mississippi. Interestingly, the state with the second-highest percentage of responses completed online is Alaska, suggesting that the introduction of the online response option has been helpful for those who live in more remote areas of the country.
Beyond Utah and Alaska, four more Western states, three Northeastern states and one Southern state make up the top 10 states with the highest percentage of 2020 Census responses completed online. The four other high-ranking Western states include Washington, Colorado, Idaho and Hawaii (technically designated a Western state by the Census Bureau). The top-ranking states of Minnesota, Wisconsin, Iowa and Nebraska fall behind in terms of uptake in the online Census response option. Minnesota ranks the highest, at 11th. As of May 4, 2020, the internet self-response rate in Minnesota was 57.8% and the total self-response rate was 67.2%. This means that about 86% of households completed the questionnaire online. In Wisconsin, Nebraska and Iowa, the percentages of households that completed the 2020 Census online through the beginning of May are 84.7%, 81.2% and 80.4%, respectively.
Online Self-Response Rates by City
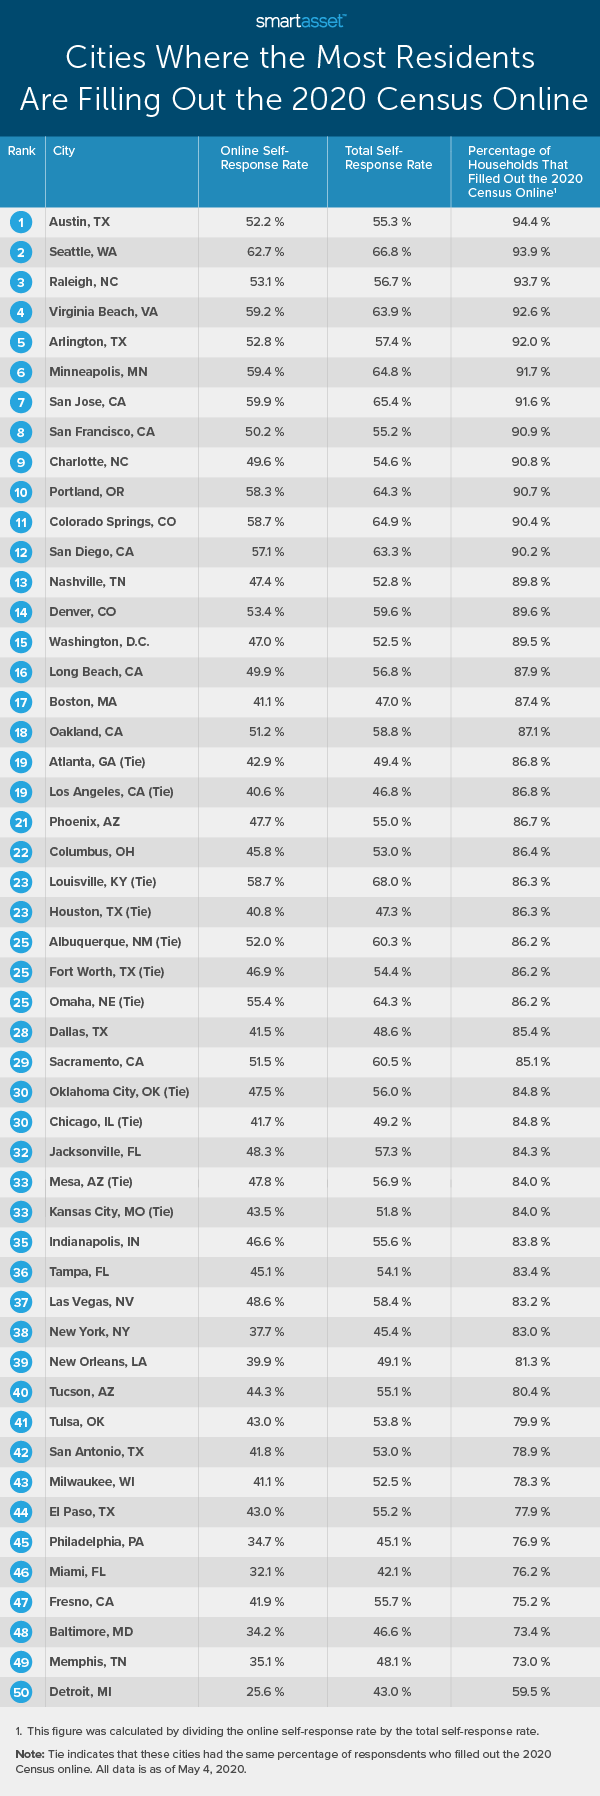
We additionally considered the percentage of responses that were completed online by city. Across the 50 largest U.S. cities, Austin, Texas has the highest number of online responses as a percentage of total self-responses so far. As of May 4, 2020, the internet self-response rate there was 52.2%, and the total self-response rate was 55.3%. This means that more than 94% of households who responded filled out the Census online.
Seattle, Washington ranks as the city with the second-highest 2020 Census online self-response rate through the beginning of May, coming in just behind Austin. According to data published by the Census Bureau, the internet self-response rate was 62.7% compared to a total self-response rate of 66.8%. This means that 93.9% of the households in Seattle completed the survey online.
Detroit, Michigan stands out in terms of its low internet response rate. Only about one in four households in Detroit have responded to the 2020 questionnaire online through the beginning of May. With a total self-response rate of 43.0%, this means that less than 60% of households in Detroit who responded did so online. By comparison, in Memphis, Tennessee, the city ranking second-lowest, 73.0% of respondents had completed the Census online. The full data across the 50 largest cities is shown below, ranked from those with the highest percentage of respondents completing the questionnaire online to those with the lowest.
Data and Methodology
Information on 2020 Census deadlines comes from censusoutreach.org while all other data for this report comes directly from the Census Bureau. Self-response rates reflect the number of households who have responded divided by the estimated total number of households in each area. The self-response period for Census collection in 2020 is expected to last through October 31, and self-response rates reported for 2020 thus far are as of May 4, 2020. To calculate the percentage of households completing the Census online, we divided the internet self-response rate by the total self-response rate.
Tips for Helping Your Community and Making Smart Financial Decisions
- Complete your 2020 Census questionnaire. Some estimates have shown that states, on average, lose out on upwards of $1,000 in funding from the federal government each year for each uncounted person. This funding could improve the school districts, transportation systems or public facilities in your state. If you haven’t yet, take the time to mail back your questionnaire, respond via phone or visit my2020census.gov. Census language support resources can be found here.
- Take a look at the tools we produce using Census data. Beyond reports compiled by SmartAsset, such as the Best Cities for Women in Tech and Cities With the Youngest Workforces, many of the tools on our website rely on Census-derived data. These tools include: our mortgage calculator, rent vs. buy calculator and retirement calculator.
- Consider professional help to formulate a more comprehensive plan. Though many of our tools are available for free, it can be difficult to figure out how much to save, what you should be spending on a house and many other financial questions. A financial advisor can help you make smarter financial decisions to be in better control of your money. Finding the right financial advisor that fits your needs doesn’t have to be hard. SmartAsset’s free tool matches you with financial advisors in your area in 5 minutes. If you’re ready to be matched with local advisors that will help you achieve your financial goals, get started now.
Questions about our study? Contact us at press@smartasset.com
Photo credit: ©iStock.com/liveslow