 Written by
The fear of skyrocketing rents can consume the thoughts of Americans who don’t own their homes. Despite an improving economy and low unemployment rates, rent increases continue to chip away at earnings. And when residents are forced to devote ever-increasing portions of their paychecks to rent, the scenario not only impacts their ability to pad their savings accounts but also lowers their demand for other goods, hurting the city’s economy by extension.
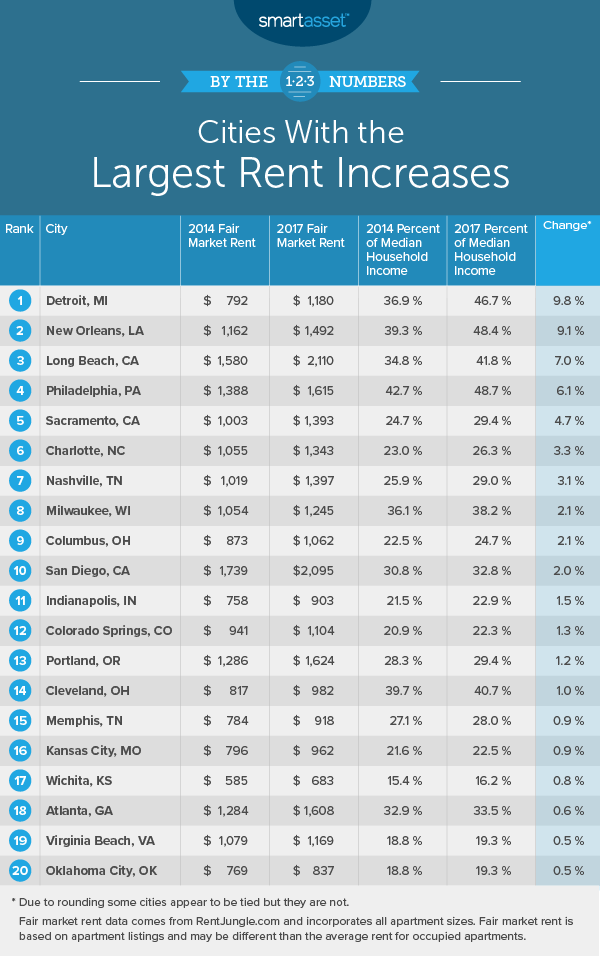
Below, we compare incomes and market rents to find the places with the largest rent increases. Specifically, we compare rent prices from 2014 to 2017 and household incomes over the same period. Check out our data and methodology below to see where we got our data and how we put it together to create our final rankings.
Key Findings
- Midwest and California – In total, six of the top 10 cities with the largest rent increases are either in the Midwest or California.
- Stagnant incomes or rising rents – The cause of the rent increase was split between two problems: large rent increases outpacing substantial gains in income, or stagnant income growth amplifying the impact of small rent increases. New Orleans is an example of the latter. Incomes here only grew by $1,500 per year while monthly rent increased by $530 over the timeline we analyzed.
- None of the usual suspects – None of the cities with the headline-grabbing rent figures cracked this top 10. New York, San Francisco and Los Angeles, three cities with traditionally high rents, actually saw their relative rent costs fall. This is due to large increases in the median household income in those cities.

1. Detroit, MI
Renters in the Motor City may find themselves struggling to make ends meet. Our research shows that the average market rent here grew nearly $390 per month from 2014 to 2017. Over that same period, median annual household income only grew by just under $4,600. That means if the average Detroit household wanted to rent the average apartment, it would need to commit just under 47% of its income. That’s up 9.8% from 2014.
2. New Orleans, LA
New Orleans is a popular city for tourists. In fact, we have some evidence that locals are buying up local rentals to place on Airbnb. That pushes up rents for everyone. Overall, the average monthly cost of a rental apartment increased by $330, or nearly $4,000 per year. The bad news for local residents of the Big Easy is that incomes are not rising very fast. From 2014 to 2017, the average household saw its income rise by just $1,500. All things considered, that means rent as a percent of household income rose by 9.1% from 2014 to 2017.
3. Long Beach, CA
Residents of California, especially Southern California, are used to spending a lot on rent. According to our research, the average rent in Long Beach in 2014 was just under $1,600 per month. Demand for rent outpaced new supply from 2014 to 2017, and the cost of rent jumped up to $2,100 per month. Incomes here have risen, but not enough to alleviate the new rent burden. Monthly rent went from being equivalent to just under 35% of household income to just under 42%, an increase of 7%.
4. Philadelphia, PA
When it comes to big Northeast cities, the City of Brotherly Love is somewhat of a bargain. The average rental unit here cost just over $1,600 per month in 2017. That’s an increase of slightly more than $226 per month from 2014. The big problem for Philadelphia and its renters is the sluggish income growth. From 2014 to 2017, median household income grew by less than 2%. The net result of the rising rent and sluggish income growth is that rent as a percent of income went from 42.7% to 48.7% over that time interval.
5. Sacramento, CA
Another California city takes a top-10 spot in this study. Traditionally Sacramento is not at the top of lists when it comes to expensive rent in California. However, our data shows that Sacramento is undergoing major changes when it comes to renting. The average rental here went from costing $1,000 in 2014 to just over $1,393 in 2017. That has left many renters handing their raises straight over to their landlords. The average rental here went from having a monthly cost equal to 24.7% of household income in 2014 to being worth 29.4% of household income in 2017.
6. Charlotte, NC
The largest city in North Carolina has seen rent prices rise recently. From 2014 to 2017, the average rental increased in price by 27%. Incomes, on the other hand, only grew by 11%. Taking those two numbers together, we see rent as a percent of income went up by 3.3%. The good news is that while rent is rising, most residents should not find themselves rent cost-burdened. In 2017, the average rental is worth only 26.3% of income for the average household.
7. Nashville, TN
Another Southern city and another popular city for Airbnb owners appears in seventh. Music City rents increased by $377, or 37%, from 2014 to 2017. The good news is that while rents did see a sudden surge, incomes also grew by a healthy amount. Over that same time period, median household income grew by $10,500 per year, or 22%. The average rental now costs 29% of income compared to 25.9% in 2014. While 29% is still within the healthy range, the fact that the figure is creeping up should concern local officials and renters alike.
8. Milwaukee, WI
Milwaukee, WI is the second Midwest city to crack this top 10. In 2014, meeting the monthly rent would have been a struggle for the average household. According to our data, the cost of the average rental was equal to just over 36% of the average Milwaukee household’s income. By 2017, that figure rose to 38.2%, a very high figure.
9. Columbus, OH
The relative cost of renting in Columbus jumped up by 2.1% from 2014 to 2017. Incomes rose by more than $5,000 over that time period, so a slow-growing economy is not the problem here. The trouble is fast-growing rent costs. From 2014 to 2017, the average rental went from costing just under $873 to costing just over $1,062. That is a change of nearly 22%. As mentioned, the other part of the equation, household income, also grew. From 2014 to 2017, the median household income in Columbus grew by 11.2%.
10. San Diego, CA
Finally, our list ends in San Diego. Residents here are the highest-earning in our top 10. But despite those high incomes, San Diego residents may not find themselves with the healthiest checking accounts after sending their rent checks in. In 2017, the average rental cost just under 33% of income, up 2% from 2014.
Data and Methodology
In order to rank the places with the largest rent increases, we looked at data for 50 of the largest U.S. cities. Specifically, we looked at data for the following two metrics.
- 2014 rent as a percent of household income. This is average rent divided by median household income. Data comes from rentjungle.com and the Census Bureau’s 2014 1-year American Community Survey.
- 2017 rent as a percent of household income. This is average rent divided by median household income. Data comes from rentjungle.com and the Census Bureau’s 2017 1-year American Community Survey.
To create the final rankings, we subtracted the 2017 rent as a percent of household income from the 2014 rent as a percent of household income. The cities with the largest difference, where the relative cost of rent went up the most, ranked first, and the city with the smallest difference ranked last.
Tips for Maximizing Your Savings
- Use the right savings account – Using the right savings account won’t make you a millionaire. But by switching from a traditional savings account to a high-yield saving account, you can increase your APY by 200 times. Specifically, check out Ally and Synchrony. Both are online-only savings accounts that offer APYs of 2% or more.
- Get the best advice – One ticket to financial freedom comes in the form of smart investments. But investing is tough, and a lot of people are chasing the same money you are. So to make the most out of your strategy, why not get help from a financial advisor. If you are not sure where to find one, check out SmartAsset’s financial advisor matching tool.
Questions about our study? Contact us at press@smartasset.com
Photo credit: ©iStock.com/AntonioGuillem