 Written by
  Has government coronavirus relief money ended up in the hands of those who need it least? The Paycheck Protection Program (PPP), which provided forgivable loans to small businesses to cover their payroll costs if they didn’t layoff workers or cut salaries, served as a central component of the Coronavirus Aid, Relief and Economic Security (CARES) Act passed in March. While businesses quickly snatched up the $349 billion allocated to the program, a new small business stimulus bill signed into law on Friday resumed the program. But controversy has erupted as details emerge about the businesses that received the first wave of PPP loans.
One key question is whether states where the COVID-19 pandemic has not hit particularly hard have received an outsize amount of the money. Below, SmartAsset examined how PPP loan funding compares to COVID-19 infection rates in each state and uncovered funding inequities, with meager distributions to some states that have been disproportionately affected thus far. For details on our data sources and calculations, check out the Data and Methodology section below.
A Comparison of PPP Loan Funding and COVID-19 Infection Rates: Is There a Correlation?
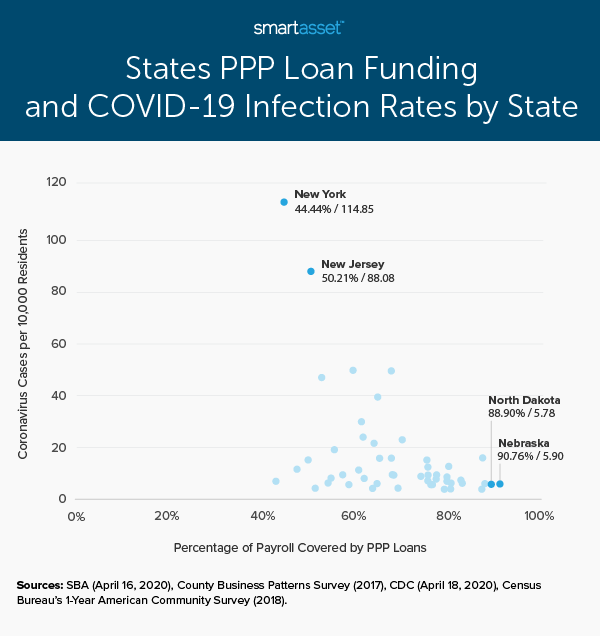
When it comes to distribution of funds to help with the pandemic, one might assume that more money would go to places where the pandemic has hit particularly hard. The data, though, shows that this has not necessarily been the case. As a matter of fact, there has been no discernible correlation between the number of infections per 10,000 residents and the percentage of a state’s eligible payroll that has been covered by loans offered through the PPP system.
This scatterplot below highlights how the 50 states compare on these two metrics. As shown, there is no distinct pattern – in other words, the percentage of a state’s eligible payroll covered by PPP does not increase or decrease as the rate of infections goes up.
It is important to note here that the rate of reported infections is not a perfect measure for the actual impact COVID-19 is having on a state. For one thing, the Centers for Disease Control (CDC) notes that it “does not know the exact number of COVID-19 illnesses, hospitalizations, and deaths for a variety of reasons.” For starters, many COVID-19 patients are asymptomatic. Healthcare access also affects the CDC’s count. A person may forgo medical attention if he or she does not have medical insurance or the means to pay for the cost of care.
The other variable in measuring the impact of COVID-19 is that stay-at-home orders may actually have a bigger impact on the health of small businesses than the infection rate. Even in the case where a state has very few infections, a governor’s decision to pass a stay-at-home order and close non-essential businesses early during the onset of the pandemic could have led many small businesses – with their doors shut – to find themselves in need of money to cover payroll.
Comparing PPP Loan Funding and COVID-19 Infection Rates: The Outliers
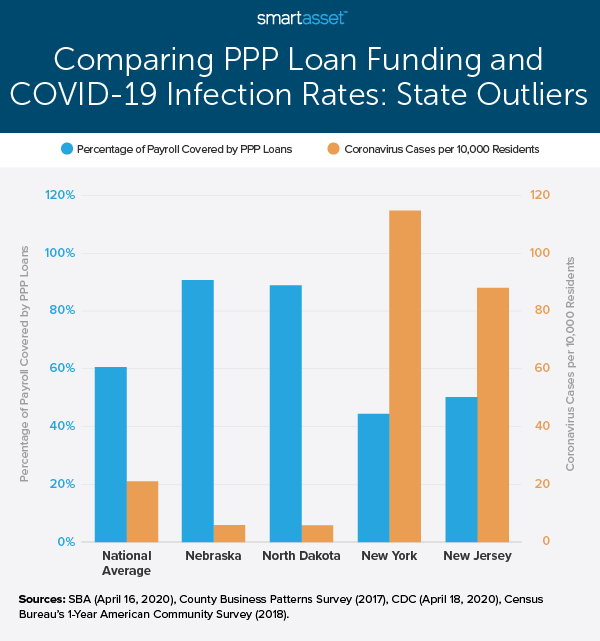
While there is no strong correlation between a state’s percentage of eligible payroll covered by PPP loans and the number of infections in the state per 10,000 residents, there are a few cases in which the two numbers diverge conspicuously, as the graph below shows. The first, Nebraska, has only 5.90 cases of COVID-19 per 10,000 residents, the 11th-lowest rate across all 50 states. The almost $3 billion in PPP loans Nebraska received, however, covered more than 90% of the eligible payroll in the state, the highest rate for this metric in the study. This is especially noteworthy, because Nebraska is one of the nine states for which there has not been a state-wide stay-at-home order (though there have been such orders in cities like Omaha, which accounts for a large portion of the state’s population). North Dakota, another state without a state-wide stay-at-home order, has had only 5.78 cases per 10,000 residents but received federal funding for 88.90% of its eligible payroll for PPP loans.
On the other end of the spectrum are two East Coast states – New York and New Jersey. The Empire State has had the highest rate of infection of any state in the entire country, with 114.85 cases per 10,000 residents. However, less than half (44.44%) of the state’s eligible payroll has been covered by $20.35 billion it received in PPP loans thus far. In New Jersey, the story is similar. The Garden State has had 88.08 cases of COVID-19 per 10,000 residents, the second-highest in the nation, but only about half, or 50.21%, of the state’s eligible payroll has been covered by its $9.53 billion in federal aid to small businesses.
There are a number of reasons these types of numbers could exist, mainly involving questions of logistics. Given that small businesses must apply for funding, firms in New York and New Jersey may not have gotten their applications in order as quickly as firms in other states. Additionally, loans are given out by local banks, not directly by the federal government or the Small Business Administration (SBA). With so many businesses in the highly populated states of New York and New Jersey, local lenders may not have been able to process enough of these loans thus far to cover the large total eligible payroll in these states. In the relatively low-population states of Nebraska and North Dakota, the banks would theoretically have had fewer applications to process and been able to give out loans that cover a higher percentage of their workforce.
The Bottom Line
After crunching the numbers, SmartAsset found that there is no strict correlation between the rate of COVID-19 infections in a state and the percentage of the state’s eligible payroll covered by loans offered through the first round of Paycheck Protection Program (PPP) funds. There are several states, though, where the difference between the rate of infections and the percentage of eligible payroll covered by these loans is especially notable.
Data and Methodology
To calculate the percentage of payroll covered by PPP loans, we used April 16, 2020 data from the Small Business Administration (SBA) on the approved dollars in PPP loans to each state and 2017 County Business Patterns Survey data on the average monthly payroll for businesses with fewer than 500 employees. To calculate coronavirus cases per 10,000 residents, we used April 18, 2020 data from the CDC and state population data from the Census Bureau’s 2018 1-Year American Community Survey.
Small Business Tips During the COVID-19 Crisis
- How much will your stimulus payment be? The government’s coronavirus economic support includes paid sick leave, business interruption insurance, a tax deadline extension and many other forms of aid for individuals and businesses. But as you manage your business, don’t forget about yourself and the possibility that you’ll receive a COVID-19 stimulus check. Our coronavirus stimulus check calculator can help you determine how much you may receive.
- Find support from other sources. Several other establishments are providing relief to individuals and businesses who’ve sustained financial loss because of coronavirus. See our full list of companies helping coronavirus-impacted people
- Rethinking your retirement strategy? Are you considering – or reconsidering – how you want to save for retirement after the crisis? Use SmartAsset’s retirement calculator to see what steps you might take.
- Seek expert advice. If you are a business owner or a worker who is struggling with money in the light of the ongoing crisis, consider working with a financial advisor to help you make the most of your finances and help you during this crisis. Finding the right financial advisor who fits your need doesn’t have to be hard. SmartAsset’s free tool matches you with financial advisors in your area in five minutes. If you’re ready to be matched with local advisors that will help you achieve your financial goals, get started now
Questions about our study? Contact press@smartasset.com
Photo credit: ©iStock.com/Kameleon007