 Written by
For Americans seeking a more affordable and less crowded alternative to the bustle of a big city but not interested in very small towns, a mid-sized city might be the best place to put down roots. But not all of them are equally suited to meet the needs of their inhabitants. That’s why SmartAsset crunched the numbers on a variety of financial factors to find the mid-sized cities that are the most livable.
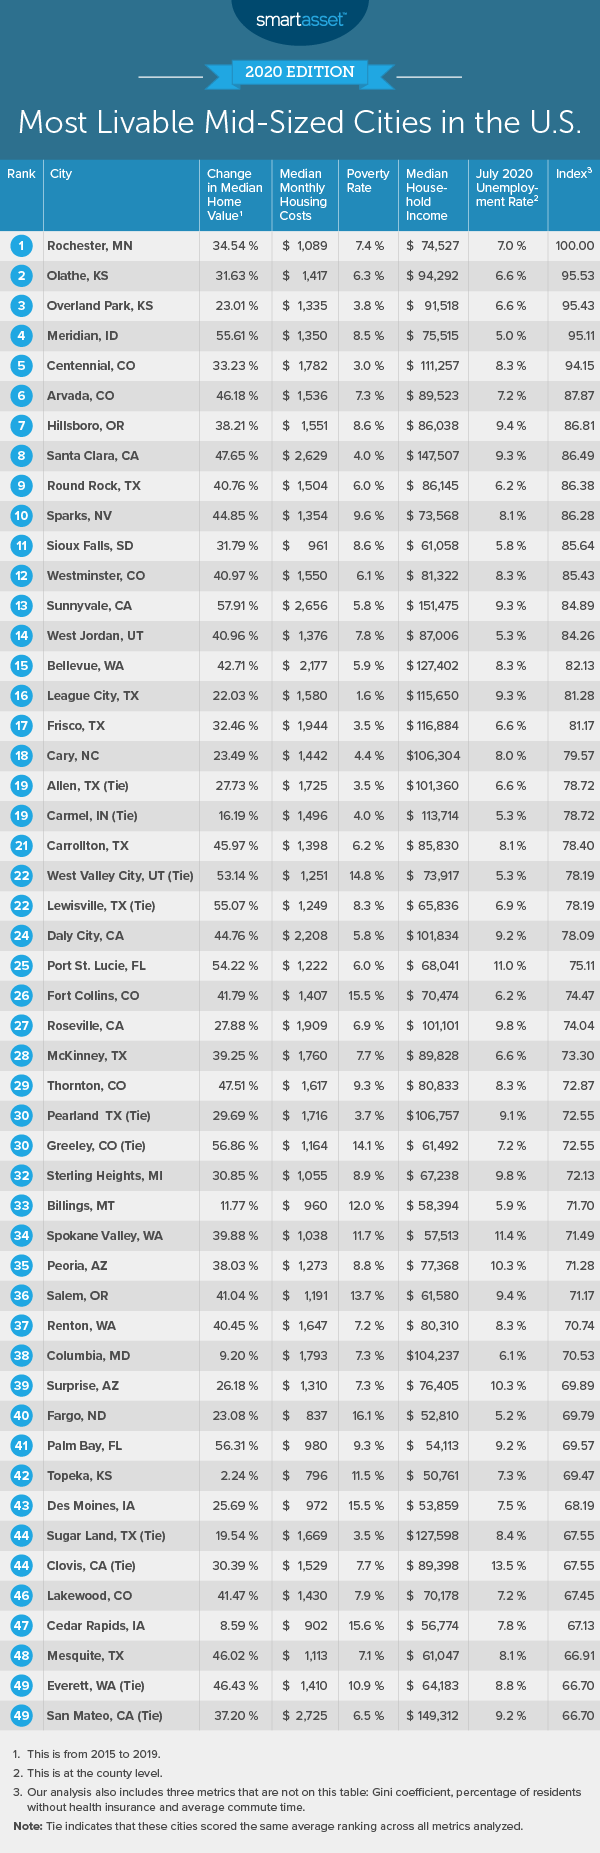
To do so, SmartAsset considered data for 227 cities across the following eight metrics: Gini coefficient, four-year home value change, median monthly housing costs, poverty rate, median household income, July 2020 unemployment rate, percentage of residents without health insurance and average commute time. For details on our data sources and how we put all the information together to create our final rankings, check out the Data and Methodology section below.
This is SmartAsset’s fourth study on the most livable mid-sized cities. Check out the 2019 edition here.
Key Findings
- Unemployment is on par with the national average. The average unemployment rate for the mid-sized cities in our study was 10.7% in July 2020, just slightly higher than the national unemployment rate of 10.2%. A few cities we analyzed, though, have significantly lower unemployment rates. In Meridian, Idaho, the unemployment rate was just 5.0%, part of the reason it ranks fourth overall. The lowest unemployment rate we found was 3.6% in Provo, Utah.
- Some consistency in the most livable mid-sized cities year over year. Exactly half of the cities in the top 10 of this year’s study were also in the top 10 last year: Rochester, Minnesota; Overland Park, Kansas; Meridian, Idaho; Centennial, Colorado and Arvada, Colorado. This suggests that while there is some consistency, some of the numbers that varied widely year-to-year, like unemployment and poverty rate, may have had a big impact in the reordering of this list.
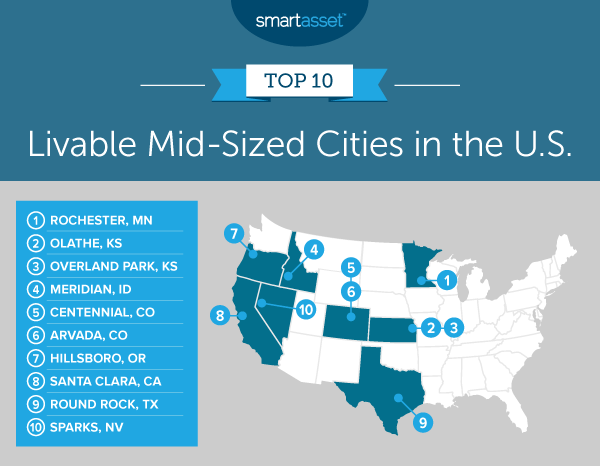
1. Rochester, MN
Rochester, Minnesota has an average commute time of just 16.2 minutes – the fifth-lowest in the study – so you don’t need to worry about adding on an extra few hours to your work day that you’ll have to spend in the car. The city had an unemployment rate of 7.0% in July 2020, the 31st-lowest of the total 227 cities we studied. It also ranked 42nd for its relatively low poverty rate, which comes in at 7.4%.
2. Olathe, KS
Olathe, Kansas ranks 12th-best for the Gini coefficient, a metric that measures income inequality. Olathe has a poverty rate of 6.3%, 24th-best among the 227 cities we analyzed. The city’s July 2020 unemployment rate is tied for 19th-lowest, at 6.6%. Median household income in Olathe ranks 34th overall and is third-highest in the top 10, at almost $94,300.
3. Overland Park, KS
Overland Park, Kansas ranks within the top 20% of study for four of the eight metrics we considered. The poverty rate in the city is 3.8%, eighth-lowest in the study. Overland Park is tied for 19th in terms of July 2020 unemployment rate, coming in at 6.6%. The city also places 31st for the percentage of residents without health insurance, at 5.2%. Furthermore, the median household income in Overland Park is 39th-highest out of 227, at $91,518.
4. Meridian, ID
Meridian, Idaho saw home values increase by 55.61% from 2015 to 2019, the ninth-highest jump in the study and the highest in the top 10. The July 2020 unemployment rate in the city was a low 5.0%, the second-best rate of all 227 cities that qualified for this study. Meridian’s Gini coefficient is the 14th-best, implying relatively low levels of income inequality.
5. Centennial, CO
Centennial, Colorado is the first of two cities in the Rocky Mountain State to crack the top 10. Centennial’s poverty rate is 3.0%, the second-lowest in the study. Centennial also has the 14th-highest median household income of all 227 cities we analyzed, $111,257. The city ranks 11th in terms of the percentage of residents without health insurance, with just 3.9% of people in Centennial being uninsured.
6. Arvada, CO
The second Colorado city in the top 10 of this study is Arvada, where home values have risen 46.18% over the four-year period from 2015 to 2019 – the 25th-highest jump in the study and third-highest in the top 10. While Arvada doesn’t fare as well in terms of commute, coming in 155th out of 227 with an average commute time of 29 minutes, the city’s unemployment rate in July 2020 was a relatively low 7.2%, ranking 32nd out of 227.
7. Hillsboro, OR
Hillsboro, Oregon has the 17th-best Gini coefficient in this study, indicating relatively low levels of inequality. Hillsboro ranks within the top 50 of the study for median household income ($86,038) and the percentage of residents without health insurance (5.6%). It also ranks within the top 60, or roughly the top quartile of the study, for its relatively high 2015-2019 change in home value and its relatively low poverty rate.
8. Santa Clara, CA
Santa Clara, California has a median household income of $147,507, the third-highest in the study and highest in the top 10. That said, it ranks near the bottom of the study for its relatively high median monthly housing costs, at $2,629. Home values have gone up quickly in Santa Clara, increasing by 47.65% over the past four years, the 18th-highest jump across all 227 the cities we analyzed. The city also ranks 10th out of 227 for its relatively low poverty rate and 14th of 227 for its relatively low percentage of residents without health insurance.
9. Round Rock, TX
Round Rock, Texas has the 15th-lowest July 2020 unemployment rate in the study, at 6.2%. It also has the 23rd-best Gini coefficient and the 20th-lowest poverty rate, at 6.0%. Round Rock does rank in the bottom half of the study for its fairly high percentage of residents who are without health insurance, at 10.4%, but it ranks within the top 50 of the total 227 cities for median household income ($86,145) and 2015-2019 change in home value (40.76%).
10. Sparks, NV
The final city in the top 10 is Sparks, Nevada, where home value increased by 44.85% from 2015 to 2019, the 30th-highest increase for this metric in the study. Sparks ranks 50th-best for its July 2020 unemployment rate overall, 8.1%. While Sparks ranks within the bottom half of the study for median monthly housing costs, which amount to $1,354, the city has a Gini coefficient of approximately 0.39, indicating relatively low income inequality.
Data and Methodology
To find the most livable mid-sized cities, SmartAsset first compiled a list of all the cities with at least 100,000 residents, excluding the 100 most populous cities. Note: Some cities that have appeared in past studies may not be in this year’s version because of shifting population totals. We compared all of the cities across the following eight metrics:
- Gini coefficient. This is a statistical measurement of income inequality. A Gini coefficient of zero indicates total equality of wealth distribution, while a coefficient of one indicates total inequality of wealth distribution across groups. Data comes from the U.S. Census Bureau’s 2019 1-Year American Community Survey.
- Median home value change. This is the percentage change in median home values from 2015 through 2019. Data comes from the U.S. Census Bureau’s 2015 and 2019 1-year American Community Surveys.
- Median monthly housing costs. Data comes from the U.S. Census Bureau’s 2019 1-year American Community Survey.
- Percentage of residents below the poverty line. Data comes from the U.S. Census Bureau’s 2019 1-year American Community Survey.
- Median household income. Data comes from the U.S. Census Bureau’s 2019 1-year American Community Survey.
- Unemployment rate. Data comes from the Bureau of Labor Statistics and is for July 2020.
- Percentage of residents without health insurance. Data comes from the U.S. Census Bureau’s 2019 1-year American Community Survey.
- Average commute time. Data comes from the U.S. Census Bureau’s 2019 1-year American Community Survey.
First, we ranked each city in every metric. We then found each city’s average ranking, giving each metric an equal weighting. We used this average ranking to determine a final score. The city with the best average ranking received a score of 100, and the city with the worst average ranking received a score of 0.
Tips for Managing Your Money
- Seek professional financial advice. Regardless of where you live, if you want to make your money work harder for you, consider finding a financial advisor. Finding a financial advisor doesn’t have to be hard. SmartAsset’s free tool connects you with financial advisors in your area in five minutes. If you’re ready to be matched with local advisors, get started now.
- Look into the future of your mortgage payments. If you’re considering moving to one of these mid-sized cities, use SmartAsset’s mortgage calculator to see what you’ll be paying each month before your deal is even finalized.
- Take every advantage that helps you save more towards retirement. Some people move to smaller cities to relax after they’ve retired. To make sure you’re able to afford that, start thinking about retirement early, and use a 401(k) or other workplace retirement plan if that is available to you.
Questions about our study? Contact press@smartasset.com.
Photo credit: ©iStock.com/jhorrocks