 Written by
Because the cost of living tends to correlate with population size, mid-sized cities are often more affordable alternatives to large cities and potentially offer better opportunities to save and invest. Your salary can go a lot further when your costs are lower, so people who use a cost-of-living calculator to compare expenses between cities may gravitate away from major metropolises.
In this study, we assess and rank the affordability and livability of mid-sized cities in the U.S. by looking at a variety of economic factors. Like in last year’s study, we identified mid-sized cities in America as those with populations above 100,000, excluding the 100 largest cities in the country. For more information on data sources and how we put together our final rankings, check out the Data and Methodology section below.
This is SmartAsset’s third annual study on the most livable mid-sized cities in America. Read the 2018 version of the study here.
Key Findings
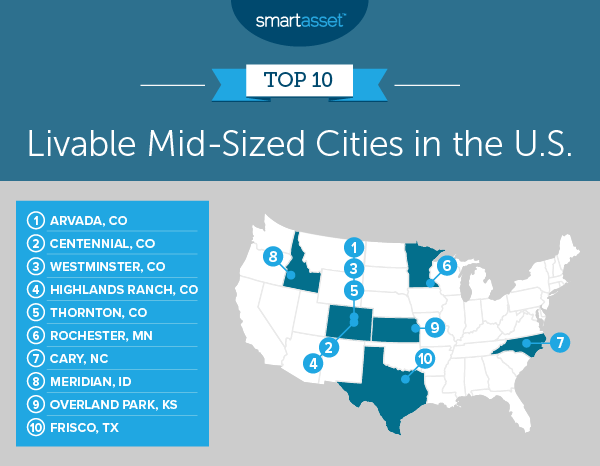
- There are many options in Colorado. Our top five most livable mid-sized cities are all located in Colorado. What’s more, all five are part of the greater Denver metro area: Arvada, Centennial, Westminster, Highlands Ranch and Thornton.
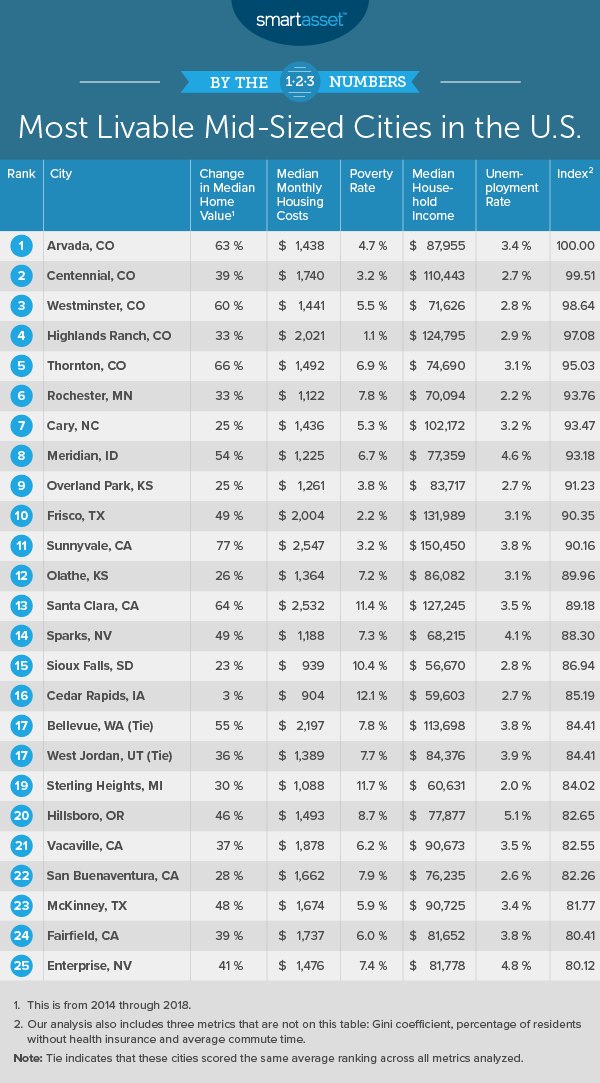
- Median home values are rising in many mid-sized cities. Home values rose over the five-year period from 2014 through 2018 in all but one of the 226 cities in our study. In fact, in more than a third of all mid-sized cities median home values rose by more than 35%, or an annualized increase of more than 6%.
1. Arvada, CO
With a population of about 120,000, Arvada is the seventh-largest city in Colorado and comes in first in our study this year of the most livable mid-sized cities in the U.S. Across the eight metrics we considered, Arvada scores relatively well for five-year median home value change and percentage of the population below the poverty line. From 2014 through 2018, home values increased by 62.64%, the seventh-highest rate for this metric across all mid-sized cities, and in 2018, about 4.7% of residents were below the poverty line, which is the eighth-lowest rate for this metric overall. Though rising home values may deter renters or new residents from buying, it is great news for current homeowners who have profited from increased demand in the housing market. Additionally, the low poverty rate indicates a strong job market and livable wages for workers.
2. Centennial, CO
Like Arvada, Centennial, Colorado is located just outside of Denver. Centennial ranks well in our study because of its low poverty rate, unemployment rate and percentage of residents without health insurance. In each of those metrics, Centennial ranks in the top 10 of all 226 cities for which we considered data. About 3.2% of Centennial’s residents were below the poverty line in 2018. In addition, about 2.7% were unemployed. The percentage of Centennial residents without health insurance falls between the two rates, at 3% in 2018.
3. Westminster, CO
Westminster, Colorado performs similarly to Arvada and Centennial across many of the metrics we considered. It ranks very well for five-year median home value change and percentage of the population below the poverty line, and it also has a relatively low unemployment rate. Median home values in Westminster increased by 60.43% from 2014 through 2018, which is good news for current homeowners there. Furthermore, about 5.5% of the population was living below the poverty line, and 2.8% of the labor force was unemployed in 2018.
Westminster falls behind Arvada and Centennial in terms of median household income. The 2018 median household income in Westminster was $71,626, while in Arvada and Centennial it was $87,955 and $110,443, respectively.
4. Highlands Ranch, CO
Highlands Ranch, Colorado, a mid-sized city with 108,257 residents in 2018, is very financially stable: Household incomes are high and inequality across socioeconomic groups is low relative to the other mid-sized cities we looked at. In 2018, the median household income in Highlands Ranch was $124,795, the sixth-highest of all 226 cities in the study.
Highlands Ranch also ranks sixth for most economic equality on the Gini coefficient. The Gini coefficient is a statistical measurement of wealth distribution using a scale of zero to one, where zero represents total equality and one represents total inequality across groups. In 2018, the Gini coefficient in Highlands Ranch was 0.37. In comparison, San Tan Valley, Arizona had the lowest Gini coefficient, at 0.33, and Columbia, South Carolina had the highest, at 0.57.
5. Thornton, CO
Located north of downtown Denver, Thornton, Colorado has low poverty and unemployment rates, ranking 27th and 24th for those two metrics, respectively. Additionally, homeowners in Thornton have benefited from the uptick in popularity of cities within the Denver metro area. Current Thornton homeowners might find it encouraging to know that their investment is paying off, as median home values have increased by almost 66% in the five years from 2014 through 2018 – the highest percentage increase of any city in our top 10 and fourth-highest across all 226 cities in the study.
6. Rochester, MN
Rochester, Minnesota moved down in our rankings from last year, when it tied for first with Olathe, Kansas. Though both the percentage of residents below the poverty line and unemployment rates in Rochester decreased from 2017 to 2018, the median household income also fell. According to Census estimates, in 2017, the median household income in Rochester was $75,464, but in 2018, it was $70,094.
Rochester remains the best city for commuters in our top 10. The average commute time for workers is 17.5 minutes, the 16th-lowest across all metro areas. In comparison, all previous five cities in Colorado in our top 10 have average commute times for workers that rank in the bottom half of all 226 cities.
7. Cary, NC
Cary is the seventh-most populous city in North Carolina with an estimated population of almost 170,000 in 2018. Like Rochester, Cary ranks lower than it did last year, when it came in fourth. Cary continues to have a low poverty rate, 5.3%, and low unemployment rate, 3.2%. However, median monthly housing costs rose between 2017 and 2018. In 2017, the median monthly housing costs in Cary totaled $1,333 and $1,436 in 2018.
8. Meridian, ID
Like many of the mid-sized cities in Colorado, home values in Meridian, Idaho have increased substantially over the past five years. In 2014, the median home value in Meridian was $193,900, and it rose 54% to $298,600 by 2018. Additionally, it ranks in the top half of all cities for median household income and median monthly housing costs. According to 2018 data, the median household income in Meridian was $77,359 and median monthly housing costs were $1,225. This means that median annual housing costs as a percentage of median household incomes in Meridian is less than 20%, well below the housing cost-burdened designation that begins at 30%.
9. Overland Park, KS
Following residents in Rochester, Minnesota, workers in Overland Park, Kansas have the second-lowest average commute time of any city in our top 10, an estimated 20.2 minutes. Additionally, poverty and unemployment rates are low, and the 2018 median household income of $83,717 is relatively high, ranking 40th of all 226 cities in our study.
The housing market in Overland Park has remained flatter than in many other mid-sized cities. The change in median home values in Overland Park from 2014 through 2018 – 24.89% – is the lowest of any city in our top 10 and falls in the bottom half of all cities. Though this is not great news for current homeowners, it may entice renters or new residents to buy. Check out our calculator to see what kind of home you can afford in Overland Park.
10. Frisco, TX
Frisco, Texas moved up from 16th in our 2018 study. The median household income in Frisco increased substantially between 2017 and 2018. According to 2017 Census estimates, the median household income was $122,302, while in 2018, it was $131,989, the third-highest amount of any mid-sized city. Unfortunately, housing costs in Frisco are also high. In 2018, the median monthly housing cost in Frisco was $2,004, the 13th-highest amount across all cities in the study.
Data and Methodology
To find the most livable mid-sized cities, SmartAsset analyzed data on cities with populations above 100,000 in 2018, excluding the 100 largest cities in the country. It is important to note that though we employed the same methodology as years past to identify mid-sized cities in the U.S., some cities may have shifted in or out of the study given changing population sizes between years. This year, 226 cities fell under our definition of mid-sized. To rank them according to livability, we compared the cities across the following eight metrics:
- Gini coefficient. This is a statistical measurement of income inequality. A Gini coefficient of zero indicates total equality of wealth distribution while a coefficient of one indicates total inequality of wealth distribution across groups. Data comes from the U.S. Census Bureau’s 2018 1-year American Community Survey.
- Median home value change. This is the percentage change in median home values from 2014 through 2018. Data comes from the U.S. Census Bureau’s 2014 and 2018 1-year American Community Surveys.
- Median monthly housing costs. Data comes from the U.S. Census Bureau’s 2018 1-year American Community Survey.
- Percentage of residents below the poverty line. Data comes from the U.S. Census Bureau’s 2018 1-year American Community Survey.
- Median household income. Data comes from the U.S. Census Bureau’s 2018 1-year American Community Survey.
- Unemployment rate. Data comes from the U.S. Census Bureau’s 2018 1-year American Community Survey.
- Percent of residents without health insurance. Data comes from the U.S. Census Bureau’s 2018 1-year American Community Survey.
- Average commute time. Data comes from the U.S. Census Bureau’s 2018 1-year American Community Survey.
First, we ranked each city in every metric. We then found each city’s average ranking, giving each metric an equal weighting. We used the average ranking to determine a final score. The city with the best average ranking received a score of 100, and the city with the lowest received a score of 0.
Tips for Finding an Affordable Home
- Expert advice. Thinking about buying a home? It might make sense to get some professional help. Finding the right financial advisor who fits your needs doesn’t have to be hard, though. SmartAsset’s free tool matches you with financial advisors in your area in just five minutes. If you’re ready to be matched with local advisors who will help you achieve your financial goals, get started now.
- Mortgage management. It’s important to know what you’ll be paying each month when you buy your home. Get a sense of what it might look like with SmartAsset’s free mortgage calculator.
Questions about our study? Contact us at press@smartasset.com
Photo credit: ©iStock.com/Faina Gurevich