 Written by
  According to the Bureau of Labor Statistics (BLS), the average annual amount spent on food in 2018 per household was $7,923, with almost $4,500 allocated for food at home and almost $3,500 for food away from home. Furthermore, spending on food increased 2.50% from the year prior. Because food makes up such a large and growing portion of expenditures across American households, the ability to afford nourishment without compromising hard-earned savings is also an important concern for many Americans, especially with the economic uncertainty brought by the recent coronavirus crisis.
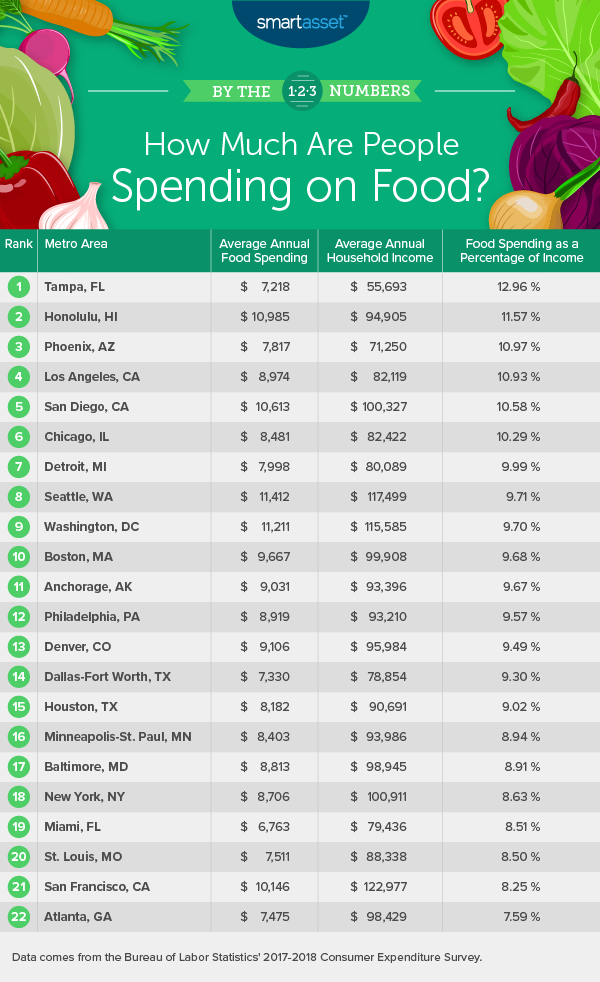
In our second annual study on where people spend the most on food, SmartAsset analyzed data for 22 metro areas across two metrics: average food spending per household and average household income. For details on our data sources and how we put all the information together to create our final rankings, check out the Data and Methodology section below.
This is SmartAsset’s second study on the places where people spend the most on food. Check out the 2019 version here.
Key Findings
- Some changes in the top 10. Six of the top 10 metro areas in our study this year were also in the top 10 in the 2019 version. However, there was a bit of shuffling among those metro areas. Tampa, Florida, which ranked fifth last year, comes in first this year, while Los Angeles, California, which tied for first last year, comes in No. 4 this year.
- Spending more on eating at home than out of the house. In 21 of the 22 metro areas we examined, the average amount of money people spend on food at home exceeds the amount they spend on food away from home. The difference between the two amounts ranges from $36 in Phoenix, Arizona to $2,527 in Anchorage, Alaska. The only metro area in which away-from-home food spending exceeds at-home food spending is Washington, D.C. The difference between the two amounts there is $47.
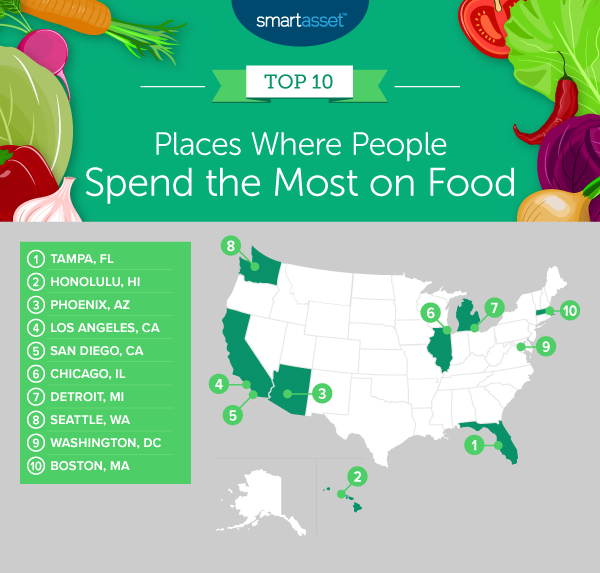
1. Tampa, FL
The Tampa, Florida metro area takes the No. 1 spot in our study on where people spend the most on food. The average household income in Tampa is $55,693 – the lowest amount for this metric across the 22 metro areas we considered – and residents spend 12.96%, or $7,218, of this income on food per year. Specifically, Tampa ranks first in the study for both percentage of income spent on food at home – at 7.49% – as well as percentage spent on food away from home – at 5.47%.
2. Honolulu, HI
The average household income in the Honolulu, Hawaii metro area is relatively high – $94,905 – but the cost of living there is relatively high as well, as the average annual spending on food is $10,985, or 11.57% of income. Honolulu has the second-highest percentage in the study of income spent on food at home – at 6.22% – and the fourth-highest percentage of income spent on food away from home – at 5.36%. Average at-home food spending totals $5,899, and average away-from-home food spending totals $5,086.
3. Phoenix, AZ
The average household income in the Phoenix, Arizona metro area is $71,250 – the second-lowest in this study – and the average food spending there is $7,817 per year, which comes to 10.97% of household income. More specifically, Phoenix residents have the second-highest percentage of of income spent on food away from home, at 5.46%.
4. Los Angeles, CA
Each year, Los Angeles, California metro area residents spend an average of $8,974 on food, which is 10.93% of the average household income of $82,119. On a more detailed level, it seems that Angelenos are making the most of their metro area’s vibrant restaurant scene, spending 5.40% of their income on food away from home.
5. San Diego, CA
Another Southern California metro area, San Diego, takes the No. 5 spot. The average income in San Diego is $100,327, and an average of $10,613, or 10.58%, of that is spent on food each year. That includes 5.56% of income spent on food eaten at home and 5.02% spent on food eaten away from home. Average at-home food spending in San Diego totals $5,580 and average away-from-home food spending there totals $5,033.
6. Chicago, IL
The average annual income in the Chicago, Illinois metro area is $82,422, and residents there spend an average of $8,481 on food per year, which amounts to 10.29% of their income. Chicago has the fifth-highest rate in our study in terms of spending on food at home, or 5.78% of income, and the seventh-highest rate for spending on food away from home, or 4.51%.
7. Detroit, MI
In the Detroit, Michigan metro area, the average household spends $7,998 on food, which is 9.99% of the average household income of $80,089. The Motor City ranks eighth-highest in the study for percentage of income spent on food at home, at 5.53% ($4,429). It also ranks eighth-highest for percentage of income spent on food away from home, at 4.46% ($3,569).
8. Seattle, WA
The Seattle, Washington metro area’s average annual household income is $117,499, the second-highest amount of all 22 metro areas we considered. Residents of the Emerald City spend an average of $11,412 on food each year, which is 9.71% of the average household income. Seattle ranks ninth-highest for spending on food eaten out of the house, at 4.44% of income, or $5,217. It ranks 12th-highest for spending on food eaten at home, at 5.27% of income, or $6,195.
9. Washington, DC
In the Washington, D.C. metro area, the average household income is $115,585 annually, the third-highest in our study. The annual food spending there is $11,211 per year, or 9.70% of income. Specifically, the nation’s capital ranks relatively low in terms of spending on food at home; it comes in seventh-lowest out of all 22 metro areas we considered – at 4.83% of income, or $5,582. By contrast, D.C. ranks sixth-highest for money spent on food outside the home, at 4.87% of income, or $5,629. It is the only metro area in our study where spending on food away from home exceeds spending on food at home.
10. Boston, MA
Rounding out our top 10 is the Boston, Massachusetts metro area. On average, Beantown residents earn $99,908 each year and spend 9.68% of it, or $9,667, on food. In spending 5.88% of their income, or $5,870, on food at home, Boston residents spend more to eat in than residents of 18 other metro areas in our study. By contrast, they spend 3.80%, or $3,797, of their income on food outside of the home, making the difference between at-home food spending and away-from-home spending about $2,000.
Data and Methodology
In order to find the places where people spend the most on food, we looked at data for all 22 metro areas included in the Bureau of Labor Statistics’ 2017-2018 Consumer Expenditure Survey. Specifically, we looked at data for the following metrics:
- Average food spending. This is the annual amount that the average household spends on food (including food at home and food away from home).
- Average household income. This is the annual average household income.
We divided the average food spending in each metro area by the average household income in that area. The result represents the average food spending as a percentage of total income. We ranked the places according to those percentages from highest to lowest.
Making the Most of Your Money
- Reassess your budget if possible. If you think you’re spending too much on food or any other item, consider making a budget or rethinking your existing budget to figure out your spending limitations in each category.
- Get informed. In light of the recent COVID-19 pandemic, many individuals and small businesses are having trouble making ends meet. The government’s coronavirus economic support includes paid sick leave, business interruption insurance, a tax deadline extension and many other forms of aid for individuals and businesses. But as you manage your business, don’t forget about yourself and the possibility that you’ll receive a COVID-19 stimulus check. Our coronavirus stimulus check calculator can help you determine how much you may receive.
- Receive expert advice. In times of uncertainty, financial advisor may be able to help with all sorts of money issues. Finding the right financial advisor that fits your needs doesn’t have to be hard. SmartAsset’s free tool matches you with financial advisors in your area in five minutes. If you’re ready to be matched with local advisors that will help you achieve your financial goals, get started now.
Questions about our study? Contact press@smartasset.com
Photo credit: ©iStock.com/Nodar Chernishev