 Written by
During the 2008 Great Recession, well-known startups like WhatsApp, Venmo and Slack were founded. In the face of an impending COVID-19 recession, some optimists have looked to these successful startups as hope that a third 21st century economic downturn may spur entrepreneurial innovation and resourcefulness. However, for many, a recession can be a daunting time to launch a business, which often puts hard-earned savings on the line. Additionally, the particulars of the COVID-19 pandemic – such as easy transmission of the infection and social distancing measures – may further lead aspiring business owners to put their plans on hold.
In this study, SmartAsset took a closer look at the state of new business applications in the U.S. Though the Census Bureau typically publishes quarterly statistics on business formation in the U.S., it recently began – for a limited time – publishing weekly data on new business applications at the national, regional and state levels. We used that data to determine the extent to which business applications have declined in the U.S. overall and states where applications have declined the most and least. For details on our data sources and how we put the information together to create our final rankings, check out the Data and Methodology section below.
Key Findings
- New business applications filed in the U.S. over the past four weeks declined about 30% compared to this time period over the past five years. Across the U.S., fewer than 7,000 new business applications have been filed for the four weeks from March 23, 2020 through April 19, 2020. By comparison, an average of about 10,000 were filed during those weeks between 2015 and 2019.
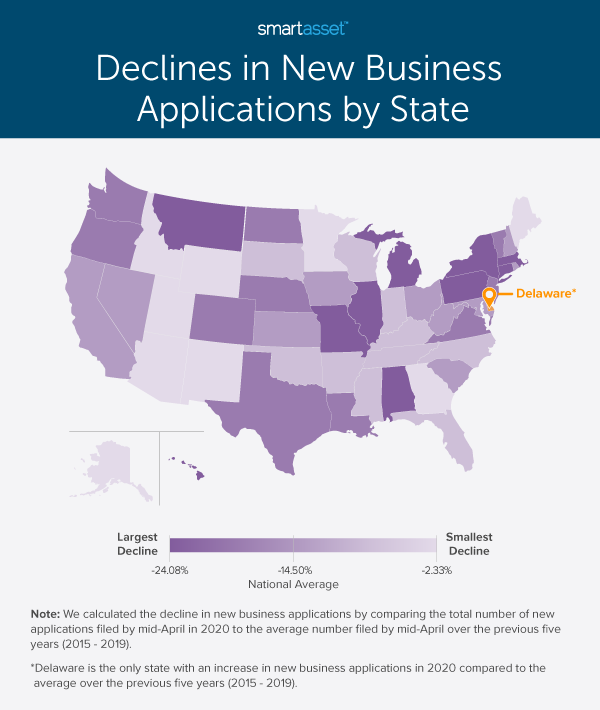
- Almost every state has reported a decline in new business applications this year. In 49 states, new business applications through mid-April in 2020 are lower than the average number of applications filed by mid-April in the previous five years. Delaware is the only state where new business applications have not slowed. Between 2015 and 2019, an average of 770 new business applications were filed by mid-April in Delaware. In 2020, that number is almost 12% higher, at 860.
- Some of the states that have been most impacted by the virus have seen the largest declines. New York, Pennsylvania, Michigan, Connecticut and Massachusetts have had some of the highest COVID-19 infection rates of all 50 states. These states rank first, second, fourth, seventh and eighth, respectively, in terms of declines in new business applications in 2020 as compared to previous years.
A Decline in New Business Applications Nationally
Since the beginning of the year through April 19, 2020, fewer than 150,000 new business applications with planned wages for workers have been filed nationally. This number marks a significant decline from previous years, as seen below. In 2019, more than 170,000 applications were filed by mid-April, and in 2018, close to 179,000 applications were filed over the same period.

Over the years from 2015 through 2019, an average of about 173,000 new business applications were filed by mid-April, according to data from the Census Bureau’s Business Formation Statistics. The total 147,930 applications filed by mid-April in 2020 represents a 14.50% decline from that five-year average.
The 2020 decline in new business applications began during the month of March, when most states had their first recorded cases of coronavirus, according to initial reports. The chart below shows the five-year average weekly number of new business applications compared to the weekly number of new business applications in 2020, looking specifically at Weeks 9 – 16 of the calendar year. Week 12 – which spans from March 16 through March 22 in 2020 – marks the first notable deviation from the five-year average; about 2,800 fewer applications were filed during that week in 2020 compared to the average number filed in Week 12 for the years 2015 through 2019. Since March 23, 2020, fewer than 7,000 new business applications have been filed weekly in the U.S.

What Has Happened at the State Level?
As noted, in 49 of 50 states, new business applications through mid-April 2020 are lower than the average number of applications filed by mid-April in the previous five years. Despite this homogeneity, the severity of the declines has varied. In four states – New York, Pennsylvania, Montana and Michigan – declines are greater than 20%. Though Delaware is the only state where the number of new business applications in 2020 through mid-April is higher than the five-year average number of new business applications over the same period, three states – Idaho, Wyoming and Maine – have seen declines of less than 5%.
The heat map below shows how states have fared amid the COVID-19 crisis by comparing new business applications filed through mid-April of this year to the average number of applications filed over the previous five years.
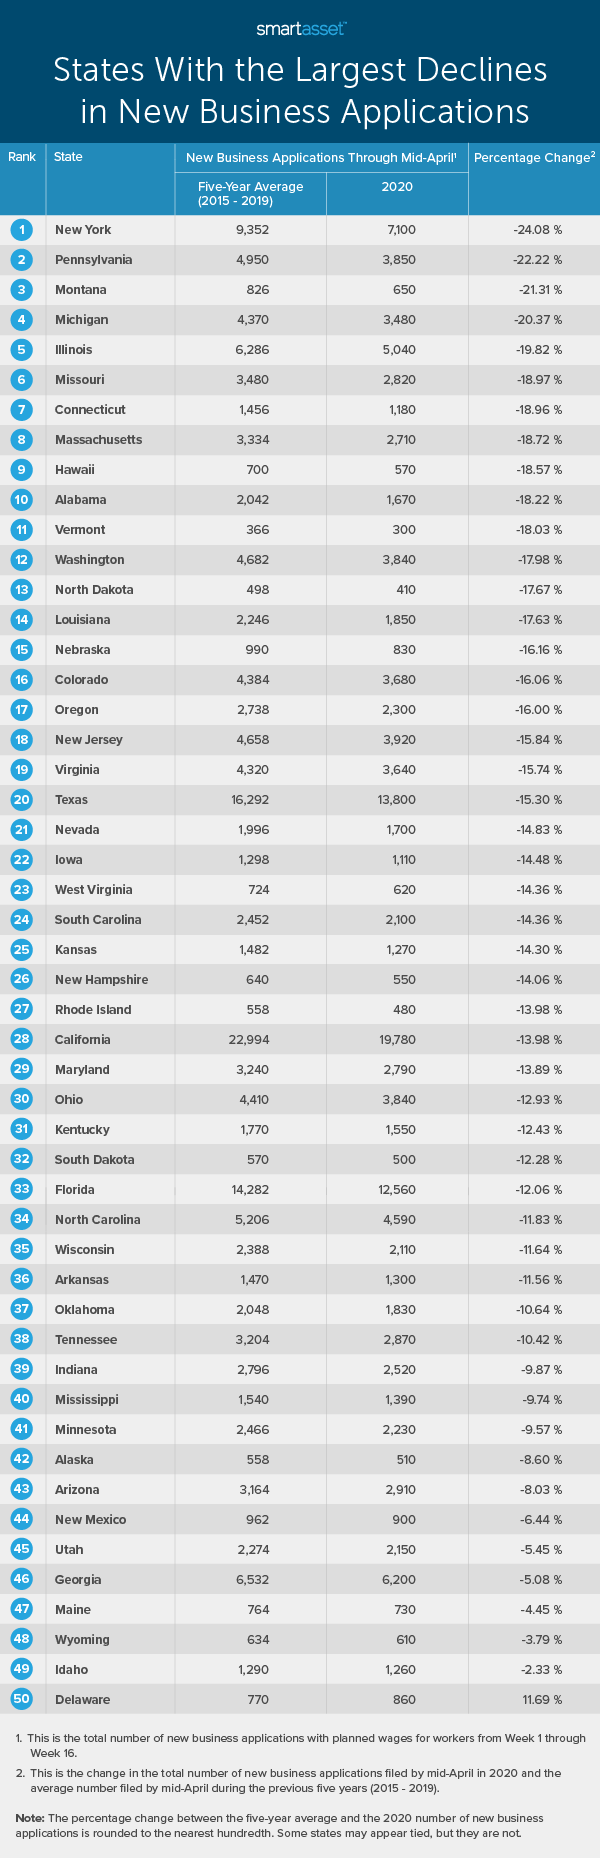
States With the Largest Declines in New Business Applications
New York – the state hit hardest by coronavirus thus far – has seen the largest declines in new business applications of all 50 states. From the beginning of the year through April 19, 2020, only 7,100 new business applications have been filed. In comparison, a total of 8,920 new business applications were filed in New York by mid-April in 2019. For the five years preceding 2020, an average of more than 9,300 new business applications were filed in New York by mid-April. This means that the number filed in 2020 marks a decline of about 24% from the five-year historical average.
Similar to the national findings, New York’s decline has largely taken place over the past several weeks, during which applications have been cut in half. Between March 23, 2020 and April 19, 2020, an average of fewer than 270 applications were filed per week. For the corresponding weeks in 2019, an average of almost 610 applications were filed weekly.
Pennsylvania follows behind New York as the state with the second-largest percentage decrease in new business applications during the first part of the year. Between 2015 and 2019, an average of nearly 5,000 new business applications were received for the first three and a half months of each year. In 2020 thus far, this number has dropped to a total of 3,850, or by about 22%. The decline in new business applications with planned wages for workers in Pennsylvania is particularly relevant in light of the high number of jobless claims in the state: without new businesses, laid-off workers will have even fewer employment opportunities.
Montana and Michigan saw the third- and fourth-largest declines in new business applications, respectively. In Montana, an average of only 30 new business applications were received in the weeks between March 23, 2020 and April 19, 2020, compared to 50 applications during the same weeks in 2019. Similarly, in Michigan from mid-March through mid-April, there have been about 20% fewer business applications filed per week.
States With the Smallest Declines in New Business Applications
Delaware is the only state to have seen an increase in new business applications this year compared to the previous past five years, though other states have had relatively small declines. Besides Delaware, Idaho was best at weathering the COVID-19 crisis in terms of its new business applications. This year, 1,260 new business applications were filed by April 19. In comparison, the average number for the five years preceding 2020 is only 30 applications higher (2.3%), at 1,290.
Wyoming and Maine have also seen declines of less than 5%. In Wyoming, 610 applications have been filed this year thus far. Meanwhile, for the five previous years, an average of 634 applications has been filed by mid-April. In Maine, 730 applications have been filed so far this year and the five-year average number for 2015 through 2019 is 764.
The table below shows the changes in new business applications for all 50 states. States are ranked from those with the largest declines to those with the smallest.
Data and Methodology
Data for this report comes from the Census Bureau’s Business Formation Statistics. Figures for new business applications are not seasonally adjusted and include only those with planned wages for workers. To find the states with the largest and smallest declines in new business applications, we calculated the number of new business applications from Week 1 of 2020 through Week 16 of 2020 (i.e. December 30, 2019 through April 19, 2020). We also found the average number of applications filed during those first 16 weeks of the year for the five-year period spanning from 2015 through 2019. Using those two figures, we calculated the percentage change from this year as compared to the five-year average.
Tips for Navigating Your Business Through COVID-19
- See if you qualify for federal aid. The Coronavirus Aid, Relief and Economic Security (CARES) Act allocated $349 billion in funding to small businesses through the Paycheck Protection Program (PPP). That money recently ran dry and as a result, the federal government allocated even more funding to small businesses through a second stimulus package. If you missed out on the first round of funding, be sure to take a look at our guide on the new bill here. We additionally put together summaries on coronavirus relief programs in each state.
- Look into other establishments offering relief. Beyond federal aid, several other establishments are providing relief to both individuals and businesses who have sustained financial loss because of coronavirus. We compiled a full list of companies helping coronavirus-impacted people, that can be found here.
- If you’re worried about your business, a financial advisor can help. Finding the right financial advisor who fits your needs doesn’t have to be hard as you strategize to protect your savings or business. SmartAsset’s free tool matches you with financial advisors in your area in five minutes. If you’re ready to be matched with local advisors that will help you achieve your financial goals, get started now.
Questions about our study? Contact us at press@smartasset.com
Photo credit: ©iStock.com/PeopleImages