 Written by
Around 2010 at the tail end of the Great Recession, the Census Bureau estimated that Americans 16 years old or older had an unemployment rate of nearly 11%. As of 2016, that figure stood at 5.8%. But while the economic downturn touched everyone, it did not affect everyone the same. Since then, some places have seen remarkable recovery in poverty rates and unemployment rates. Consequently, residents where things are on the up and up are less likely to be housing-cost burdened and are able to afford to put some money away into savings accounts. Below, we look at these trends to find the places where the quality of life is improving the most.
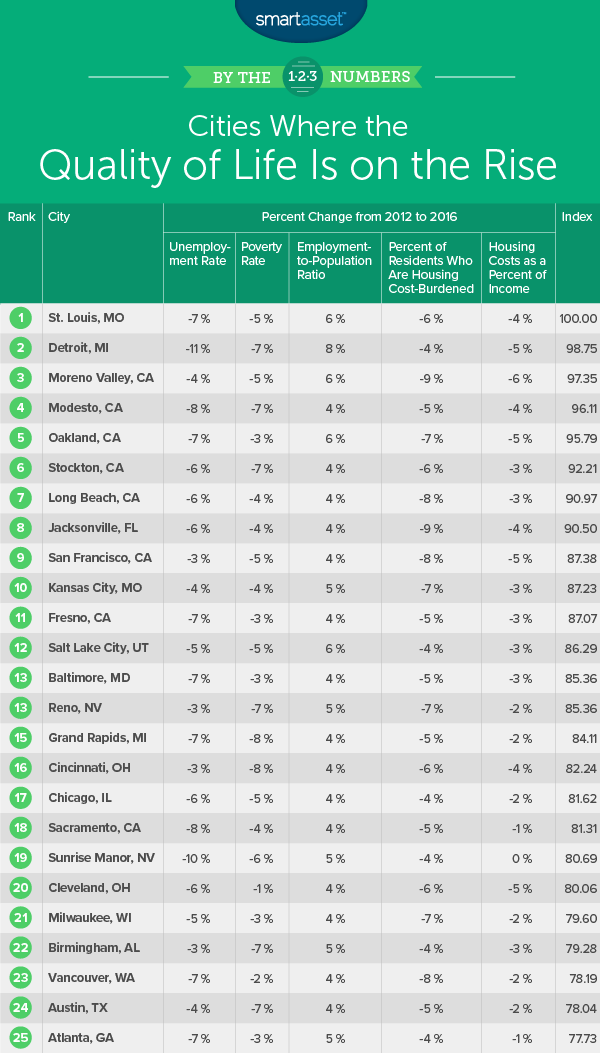
Below we look at factors like unemployment rate change, poverty rate change, change in employment to population ratio, change in percent of residents who are housing-cost burdened and median housing costs as a percent of income to rank the places where quality of life is on the rise. To see where we got our data and how we put it together to create our final rankings, check out our data and methodology section below.
Key Findings
- California is seeing improvements – In total, California takes six of the top 10 spots in this study. Unemployment rates and poverty rates are for the most part headed in the right direction. But one of the most difficult obstacles to overcome in California is the cost of living. That’s true even in those areas where data suggests there are improvements. The percent of residents who spend at least 30% of their income on housing is down and median housing costs as a percent of median income is also down in the California cities in our top 10..
- Midwest is headed in the right direction – Three Midwest cities crack our top 10. These cities were having a tough time in 2012. That gave them plenty of space to improve. For example, the unemployment rate in St. Louis dropped by 7% and the unemployment rate in Detroit dropped by 11%. However, both still have plenty of space to improve. Both cities still have higher-than-average unemployment rates.
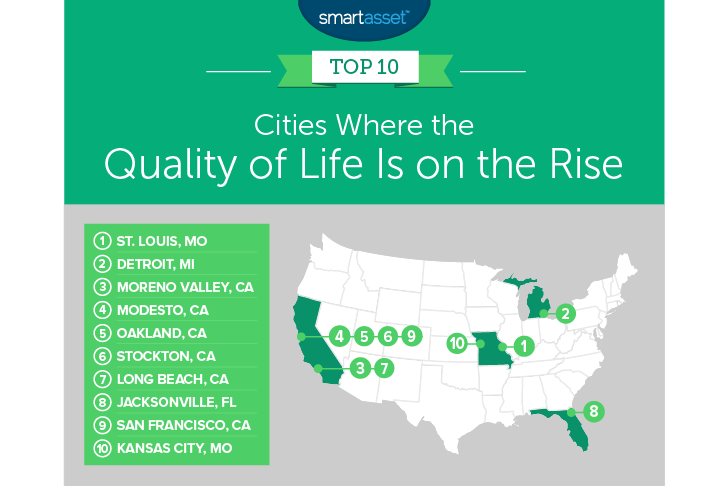
1. St. Louis, Missouri
The Gateway to the West takes the top spot. Census Bureau data reveals that from 2012 to 2016 the unemployment rate here dropped from 14.1% to 7%. That is a drop of 7.1%, one of the largest in our study. A higher employment rate comes with many benefits. The poverty rate here dropped by 5.4%, and more people were encouraged to work. The percent of the working age population who were employed increased by 6.2%.
2. Detroit, Michigan
Detroit has long suffered from the decline in manufacturing jobs. In particular the decline in the automobile industry left the city scrambling for ways to create new economic opportunity.
In 2012 the Census Bureau estimates that the city of Detroit had a poverty rate of 42.3% and an unemployment rate of 27.7%. At the same time only 37% of working-age residents had a job. All those figures improved between the 2012 to 2016 time period. The unemployment rate for residents 16 and over fell by 11%, the poverty rate dropped by about 7% and the percent of working-age residents with jobs increased by over 8%. The reason Detroit falls to second is because despite all these improvements, many residents struggle continue to struggle with housing costs. The housing-cost burdened rate here fell by only 3.5%, from 43.3% to 41.8%.
3. Moreno Valley, California
Moreno Valley is one of six California cities in this top 10. For this city it is all about housing affordability. In 2012, the majority of households here spent at least 30% of their income on housing. That figure fell to just over 41% in 2016. Incomes here also took off between 2012 and 2016. The median household went from earning $50,900 in 2012 to $64,000 in 2016. That led to the median housing costs as a percent of income dropped from 32% to 26%.
4. Modesto, California
Modesto, California comes in fourth. From 2012 to 2016 the unemployment rate here fell by 8.4%, a top 10 rate. Along with the growth in jobs, many families here were able to pull themselves out of poverty. The poverty rate in Modesty fell by 7.3%, the third largest decline in our study. With more jobs and income, residents have been able to save more money. On average, housing costs make up 4.4% less of income in 2016 than it did in 2012.
5. Oakland, California
In 2012, residents here over the age of 16 had an unemployment rate of 13%. Over the five-year period from 2012 to 2016 the unemployment rate dropped by 6.7%. Despite the large increase in rent costs and home values, the percent of residents here who are housing-cost burdened dropped by 7%. Particularly impressive were the rise in incomes. From 2012 to 2016 the median household income grew by $20,000, from $48,000 to $68,000.
6. Stockton, California
Other than unemployment rate one of the most important metrics which attempt to measure quality of life is the poverty rate. In 2012 Stockton had a poverty rate of nearly 25%. By 2016 that figure had fallen to 18%, which was the fifth sharpest drop in poverty rates in our study. Stockton secured no other top 10 scores but did finish in the top 40 for every other metric.
7. Long Beach, California
Another California city takes seventh. Long Beach has seen its fortunes rise recently. One topic that troubles all California residents are housing costs. This is true whether you’re in the Bay Area where housing costs are highest or whether you’re in Southern California. Long Beach residents saw their housing-cost burden drop significantly. The percent of residents who are housing-cost burdened dropped by 8% and median housing costs are now worth 3.4% less of the median household income.
8. Jacksonville, Florida
Florida’s largest city has made remarkable strides over the past few years. The percent of residents who spend at least 30% of their income on housing dropped by 9%, from 41% in 2012 to 32% in 2016. The main reason residents are less likely to be housing-cost burdened are the rising incomes. Median household incomes here increased from $42,800 in 2012 to $51,300 in 2016. Over that same time period hosing costs only increased from $957 per month to $978 per month.
9. San Francisco, California
Compared to other cities in this top 10, San Francisco had it pretty good in 2012. Back then, the unemployment rate for residents 16 and over was only 7.7% and the poverty rate was only 15%. While those numbers did improve, San Francisco did not have as much space to improve as other cities. Where things have improved are the housing costs, at least relative to the incomes. Household incomes here have managed to outpace housing cost increases, despite the latter’s much discussed rise. Between 2012 and 2016 the percent of residents who are housing-cost burdened decreased by 8.4% and the percent of income the average household would need to dedicate to afford the average home decreased by nearly 5%.
10. Kansas City, Missouri
Kansas City takes the final spot. The most exciting numbers for Kansas City come in the growth in employment for working age residents. The percent of working age residents with jobs increased by over 5.1%. Along with more working residents, the percent of residents who struggle to make their monthly mortgage and rent payments also shrunk. From 2012 to 2016 the percent of residents who are housing-cost burdened dropped by 7.1%.
Data and Methodology
In order to rank the cities where the quality of life is on the rise we looked at data for 150 of the largest cities in the US. Specifically we compared them over the following five metrics:
- Unemployment rate change. This is the percent change in unemployment rate.
- Poverty rate change. This is the percent change in unemployment rate.
- Employment-to-population ratio percent change. This is the percent change in employment-to-population ratio.
- Percent change in residents who are housing-cost burdened. This is the percent change in residents who spend at least 30% of their income on rent.
- Median housing costs as a percent of household income percent change. This is the percent change in median housing costs as a percent of household income.
Data for all metrics is the five-year change from 2012 to 2016. Data comes from the Census Bureau’s 2012 and 2016 1-year American Community Survey.
To create our final ranking we first ranked each city in each metric. Then we found each city’s average ranking giving equal weight to each metric. We used this average ranking to create our final score. The city with the best average ranking received a 100. The city with the worst average ranking received a 0.
Tips for Maximizing Your Savings
- Use the right savings accounts – If you have finally done all the hard work of careful budgeting to finally have some money to save, don’t throw away all your effort by not utilizing a high-yield savings account. Normal brick and mortar banks offer very low APRs in their savings accounts. Online only banks like Synchrony or Ally offer APRs above 1%. By making the right choice about which savings account to use you can make your money work for you.
- Get the best advice – While using the right savings account or checking account will give you a little boost to your income, it won’t change your life. Investing your money adroitly can open up a whole new world of possibilities, even possibly an early retirement. If you are new to investing though, you probably want to get an expert’s opinion, investing is risky after all. If you are not sure who to talk to, SmartAsset’s financial advisor matching tool will pair you with up to three local financial advisors who all fit your investing profile.
Questions about our study? Contact press@smartasset.com.
Photo credit: ©iStock.com/PeopleImages